
Figures & data
Fig. 1 (Colour online) Disease symptoms caused by Boeremia exigua var. exigua on lima bean and fungal morphology. a, Discrete tan spot necrotic lesions on lima bean field sample. b, coalescence of necrotic tan spot lesions on a lima bean field sample. c, reaction of Boeremia exigua var. exigua on oatmeal agar to 5 M NaOH at 20 min after application; and d, reaction to 5 M NaOH at 120 min after application; (e) pycnidium and conidia at ×400 magnification.
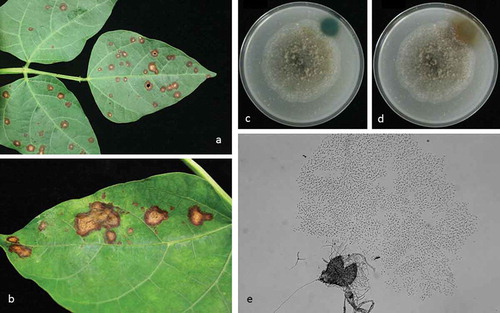
Fig. 2 Phylogenetic relationships inferred using a Bayesian inference dendrogram between Boeremia exigua var. exigua identified in this study (presented in bold) and other Didymellaceae using concatenated sequences of the internal transcribed spacer region (ITS), partial actin (ACT), β-tubulin (TUB), translation elongation factor (TEF), and partial calmodulin (CAL) genes. CBS-KNAW Fungal Biodiversity Centre reference numbers are provided following species name. Numbers at branches indicate percentage bootstrap support. Scale bar indicates the proportional genetic similarity. The dendrogram is rooted using Phoma paspali CBS 560.81.
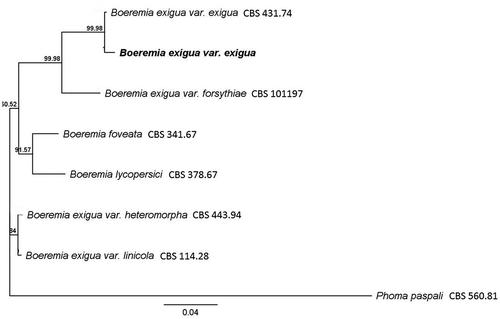
Table 1. Effect of inoculation with Boeremia exigua var. exigua on foliar disease severity (%) in lima, snap and soybean across two trials conducted in the greenhouse. Data were log transformed before analysis and means reported here are back-transformed.
Table 2. Effect of inoculation with Boeremia exigua var. exigua on disease incidence and severity (%) on lima bean, snap bean and soybean cultivars. Experiment 1 reports analysis of combined data from two greenhouse trials. Experiment 2 reports data from a single greenhouse trial. Data were log-transformed before analysis and are reported herein as back transformed.