Figures & data
Fig. 1 (Colour online) Symptoms of black root rot on Korean ginseng seedlings and morphological features of the pathogenic fungus T. basicola. (a) Symptoms of black root rot. (b) A fungal colony on PDA after 15 days of incubation. (c) Single-celled hyaline endospores (bar = 10 μm). (d–e) Production of endospores deep within the phialide (bar = 20 μm). The youngest septum in the process of formation (white arrow) and the tip of the phialide wall (black arrow) are indicated. Protoplasmic continuities across septa are shown by black arrowheads. (f) Numerous dark aleuriospores (bar = 50 μm). (g) Aleuriospore breaking up into individual spores (arrowhead).
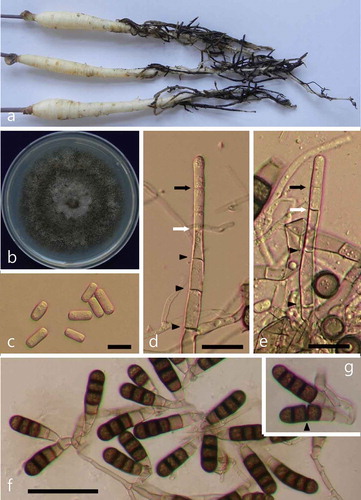
Fig. 2 Phylogenetic relationship based on ITS sequences, showing the closest known relatives of Thielaviopsis species. DNA sequences from the NCBI nucleotide database were aligned using ClustalW, and a phylogenetic tree was constructed using the neighbour-joining method. The numbers above the branches indicate bootstrap values. Bars indicate the number of nucleotide substitutions per site. The isolate studied in the present study is marked in bold.