
Figures & data
Fig. 1 Maximum air temperatures and precipitation for the months of April through October for 2008 to 2010 at Jackson and Milan, TN. The set of numbers in the x-axis indicates the monthly total precipitation.
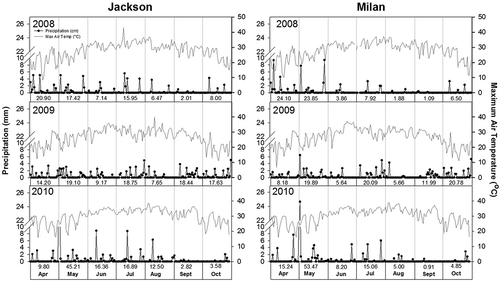
Table 1. Probability of greater values of F resulting from Type III tests of fixed effects P and K from colony forming units (CFU) of Macrophomina phaseolina and soil from soybean tissue from two locations (Milan and Jackson, TN, USA) during 2008, 2009 and 2010 obtained from SAS PROC MIXED analysis.
Table 2. Location-by-year interaction on soil colony forming units (CFU) from soybean grown in Jackson and Milan, TN, USA in 2008, 2009 and 2010.
Fig. 2 (Colour online) Trends of phosphorus (expressed as P2O5) and potassium fertilizer (expressed as K2O) on CFU g−1 of tissue (A and B) and soil (C and D) at Jackson (filled circles and solid lines) and Milan (open circles and dashed lines); filled and open circles are actual CFUs; dashed and solid lines are regression lines. Phosphorus was applied at six rates: 0, 22, 45, 67 and 90 kg P2O5 ha−1; and K was applied at six rates: 0, 45, 90, 134 and 179 kg K2O ha−1 with the sixth level applied for both equal to the recommended fertilizer application rate based on annual soil P and K testing in 2008, 2009 and 2010 at Jackson and Milan, TN, USA.
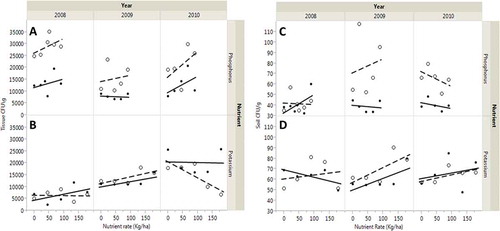
Table 3. Effect of phosphorus and potassium fertilizer rates on colony forming units per gram of M. phaseolina from tissue and soil at Jackson and Milan, TN, USA in 2008 through 2010.