Figures & data
Fig. 1 (Colour online) Symptoms of (a–b) brownish black spots on fruits, and (c) medium brown to greyish white spots on leaves of naturally infected okras in the field. Colony on (d) PDA, (e) MEA and (f) OA at 25°C for 14 days. Microscopic structures of (g) pycnidia and (h–i) conidia. Symptoms observed in pathogenicity tests (j–k) on fruits, and (l) on leaves. Bars: g = 100 μm, h-i = 20 μm.
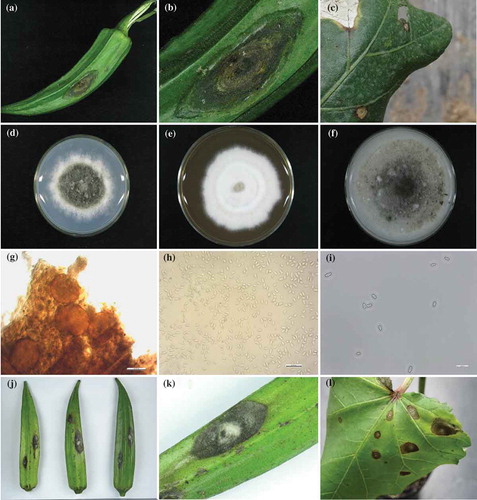
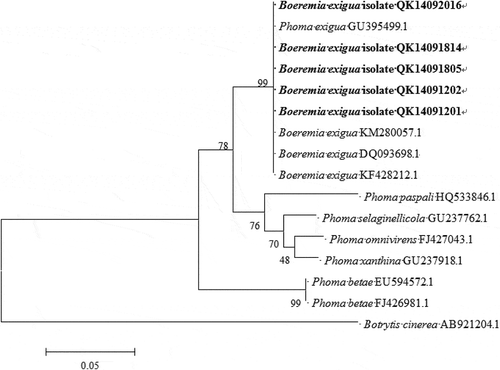
Fig. 2 Phylogenetic tree obtained through the neighbour-joining method using the MEGA 5.1 program based on the internal transcribed spacers (ITS) sequence of five isolates from this study, and 10 isolates retrieved from GenBank. Bootstrap support values (%) resulting from 1000 replicates are shown at the branch points. Botrytis cinerea served as the outgroup.