Figures & data
Fig. 1 (Colour online) Leaf spot of tomato caused by F. proliferatum. (a) Necrotic lesions on tomato leaf in commercial tomato greenhouse; (b) 7-day-old colony of F. proliferatum growing on potato dextrose agar at 20°C; (c) Fully grown colony with sclerotia; (d) Macroconidia and microconidia of the fungus formed on PDA; (e), (f) Necrotic spots on tomato leaf and stem infected with F. proliferatum 4 days after artificial inoculation.
![Fig. 1 (Colour online) Leaf spot of tomato caused by F. proliferatum. (a) Necrotic lesions on tomato leaf in commercial tomato greenhouse; (b) 7-day-old colony of F. proliferatum growing on potato dextrose agar at 20°C; (c) Fully grown colony with sclerotia; (d) Macroconidia and microconidia of the fungus formed on PDA; (e), (f) Necrotic spots on tomato leaf and stem infected with F. proliferatum 4 days after artificial inoculation.](/cms/asset/1506fb77-26d2-47e5-8bed-beffa4a4db31/tcjp_a_1217277_f0001_oc.jpg)
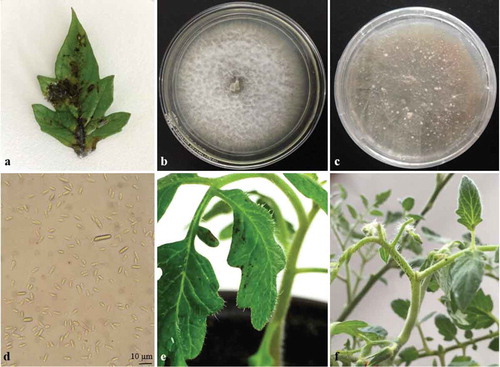
Table 1. Sequence identities for the five genes found by a BLAST search in the GenBank database.
Fig. 2 Phylogenetic tree constructed with sequences of partial translation elongation factor-1α (TEF). Gene sequences show the closest known relatives of F. proliferatum, inferred by the neighbour-joining method and reference sequences retrieved from GenBank database. The per cent bootstrap support values (1000 replications; ≥70%) are shown in the branches. Bar = number of nucleotide substitutions per site.
![Fig. 2 Phylogenetic tree constructed with sequences of partial translation elongation factor-1α (TEF). Gene sequences show the closest known relatives of F. proliferatum, inferred by the neighbour-joining method and reference sequences retrieved from GenBank database. The per cent bootstrap support values (1000 replications; ≥70%) are shown in the branches. Bar = number of nucleotide substitutions per site.](/cms/asset/486158c6-b826-417b-9da5-f11191d7df4f/tcjp_a_1217277_f0002_b.gif)