Figures & data
Table 1. Morphological variables of M. roreri isolates observed after 15 days growth on malt extract agar at 27°C.
Table 2. Percentage of isolates of M. roreri classified into each group described in .
Fig. 1 (Colour online) Representative images of isolates belonging to the colour groups from 1 to 14 described in . The number in each figure represents the colour group from .
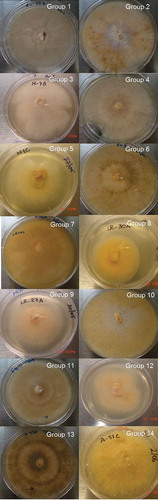
Fig. 2 (Colour online) Representative meiospore of M. roreri strains isolated from six regions of Ecuador.
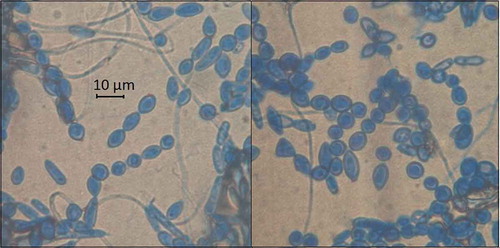
Table 3. Parameter estimates based on the Gompertz model fitted to the growth of M. roreri isolates classified according to the colour groupings from .
Fig. 3 (Colour online) Growth curve of M. roreri isolates from colour groups that showed significant growth differences (P < 0.05) fitted to a Gompertz model.
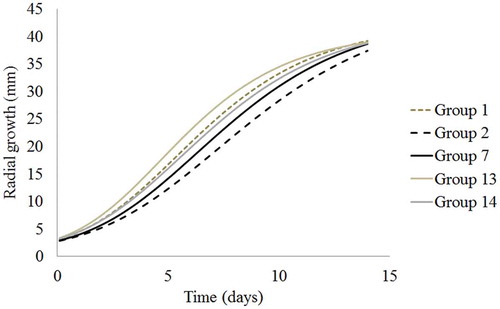
Table 4. Genetic diversity of the six groups of M. roreri strains.
Fig. 4 Representative gel photograph of PCR-RFLP of the ITS1-ITS2 regions of M. roreri using restriction enzymes. The lane numbers on the gels correspond to the sample codes in Supplementary . M indicates the DNA ladder.
Fig. 5 (Colour online) Factors 1 and 2 (F1 and F2) of the multiple discriminant analyses of ITS-RFLP patterns of M. roreri isolates grouped by colour (a) and provinces (b).
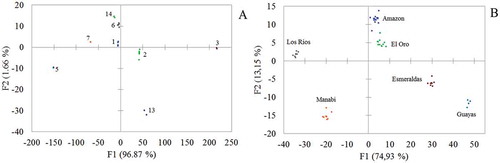
Table 5. Polymorphic nucleotides detected in the ITS1, 5.8 s, and ITS2 regions of representative isolates of M. roreri obtained in this study and compared with isolates from Ecuador previously deposited in GenBank.
Fig. 6 Neighbor-joining tree of the ITS1, 5.8 s and ITS2 region of the representative isolates obtained in this study and the most similar isolates from GenBank. The bootstrap values of 2000 interaction are also shown.