Figures & data
Fig. 1 (Colour online) Plum pox virus symptoms on a peach tree in orchards in Aguascalientes, Mexico.
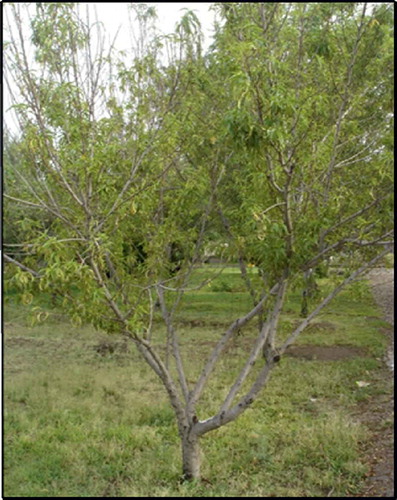
Table 1. Number of peach leaf samples collected, and those positive for Plum pox virus by dot blot or RT-PCR.
Fig. 2 (Colour online) (a) Dot blot analysis performed on samples collected from different orchards for Potyvirus scrutiny. 1/a: negative (healthy plants), 2/a: positive for Potyvirus (Papaya ringspot virus), 2/b to 8/g: samples from apparently infected peach trees. (b) RT-PCR products obtained with consensus oligos for Potyvirus. In all cases a band of 260 bp was obtained. Lanes: (1) DNA ladder, (2) positive control, and (3–7) samples of infected peach trees. (c) RsaI restriction profile in the CP region representative of PPV-D genotype by RFLP analyses. Lanes: (1) DNA ladder, (2) PPV genotype D, showing the amplicon of ~450 bp and two fragments of ~300 and ~150 bp, (3) complete digestion with RsaI.
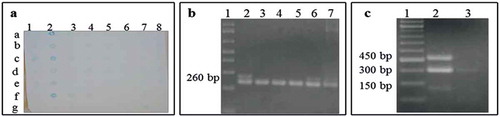
Table 2. Pathogenicity test on three plant species using Plum pox virus inoculum and percentage of inoculation success.
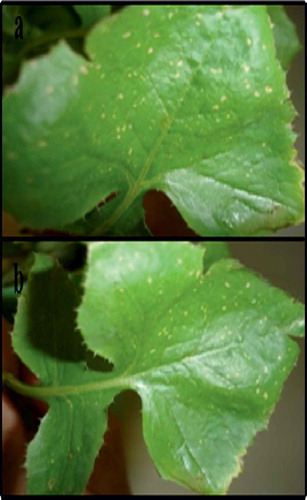
Fig. 3 (Colour online) Pathogenicity test on S. oleraceus showing necrotic leaf spots on leaves.