
Figures & data
Table 1. Details regarding the primers used in this study.
Fig. 1 (Colour online) Comparison of disease response of ‘Brazil’ and ‘Formosana’ banana. (Left) ‘Formosana’ banana; (right): ‘Brazil’ banana.
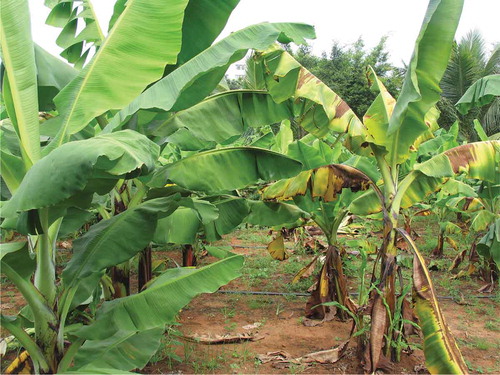
Fig. 2 (Colour online) Comparison between the ‘Formosana’ and ‘Brazil’ roots infected by Foc TR4. A, Uninoculated ‘Brazil’ plantlet roots. B, ‘Formosana’ roots. C, ‘Brazil’ roots. Scale bar = 20 µm.
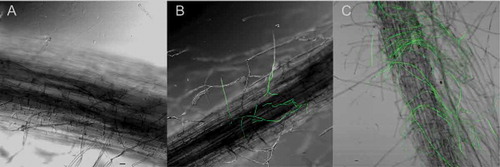
Fig. 3 Confirmation of the infection of banana plantlets by Foc TR4 based on a PCR assay. M: DL2000 marker; K+: Foc TR4 genomic DNA; K−: DNA extracted from the roots of sterilized ‘Brazil’ plantlets; Lanes 1–5: DNA extracted from the roots of five infected ‘Brazil’ plantlets; Lanes 6–10: DNA extracted from the roots of five infected ‘Formosana’ plantlets; K1: H2O.
Table 2. Details regarding the raw and high-quality reads in bananas ‘Formosana’ and ‘Brazil’.
Fig. 4 (Colour online) Gene ontology classifications. The horizontal axis presents the GO term sub-categories, the left vertical axis corresponds to the proportion of genes included in the sub-categories, and the right vertical axis represents the number of genes in the sub-categories.
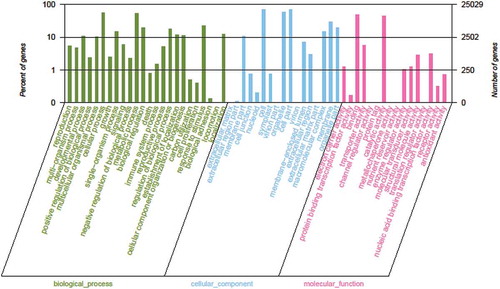
Fig. 5 (Colour online) Cluster of orthologous group classifications. The horizontal axis presents the functional categories, while the vertical axis corresponds to the number of unigenes in the categories.
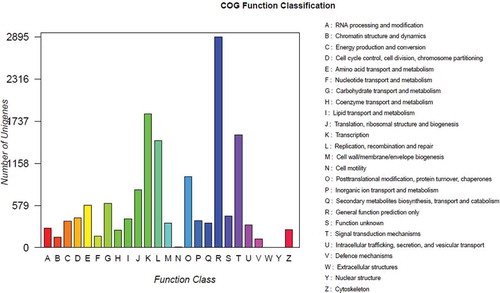
Table 3. The most enriched pathways for the differentially expressed genes in banana.
Table 4. Previous transcriptomics studies involving banana plants infected by Foc TR4.
Table 5. Relative expression levels of specific resistance mechanism-related genes according to qRT-PCR in banana.
Table 6. Specific resistance mechanism-related genes in banana.
Table 7. Phytoalexin biosynthesis-related genes in banana.
Table 8. Stress resistance-related genes (non-specific responses to biotic and abiotic stresses) or genes related to environmental interactions in banana.
Table 9. Growth- and development-related genes in banana.