Figures & data
Table 1. Single spore isolates of Claviceps purpurea (Fr.) Tul. assessed for pathogenic variation on lines of hexaploid wheat (Triticum aestivum L.) and durum wheat (T. turgidum L. var. durum).
Table 2. The least squares means for the honeydew ratingsa obtained from the inoculation of 41 single spore strains of Claviceps purpurea (Fr.) Tul. onto three lines of durum wheat (T. turgidum L. var. durum) and five lines of hexaploid wheat (Triticum aestivum L.).
Table 3. The least squares means of the weight (mg) of sclerotia per spike obtained from the inoculation of 41 single spore strains of Claviceps purpurea (Fr.) Tul. onto three lines of durum wheat (T. turgidum L. var. durum) and five lines of hexaploid wheat (Triticum aestivum L.).
Fig. 1 (Colour online) Correspondence analysis biplot of the contingency table involving wheat differential line, isolate sampling location and isolate host source for honeydew production (H1 to H4). The graph is derived from the eigenanalysis of these contingency tables. The first eigenvector accounted for 73.2% of the variation in the contingency tables, and the second eigenvector accounted for 23.2% of the variation. The path from H1 to H4 indicates increasing honeydew production with means of 1.0, 2.0, 3.0 and 4.0 for H1, H2, H3 and H4, respectively. Wheat differential lines: 9260B-173A (9260B), ‘Kyle’, ‘Melita’, HY630, ‘Kenya Farmer’, ‘Lee’, ‘Vista’, ‘Cadillac’. Isolate sampling location: United Kingdom (UK), Alberta (AB), Saskatchewan (SK), Manitoba (MB). Isolate host source: rye (Rye), blackgrass (BG), triticale (Tri), durum wheat (Dur), hexaploid wheat (Wht), oats (Oat), barley (Bar).
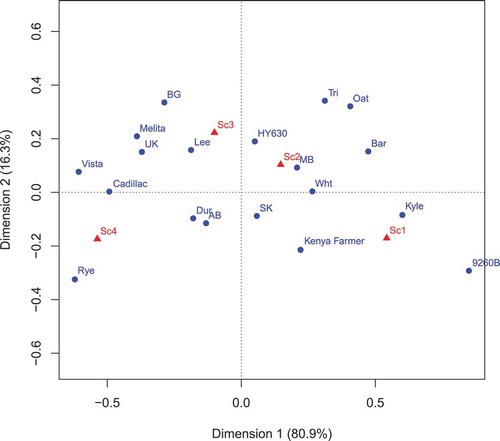
Fig. 2 (Colour online) Correspondence analysis biplot of the contingency table involving wheat differential line, isolate sampling location and isolate host source for sclerotial weight per spike (Sc1 to Sc4). The graph is derived from the eigenanalysis of these contingency tables. The first eigenvector accounted for 80.9% of the variation in the contingency tables, and the second eigenvector accounted for 16.3% of the variation. The path from Sc1 to Sc4 indicates increasing sclerotial weight with means of 11.2, 80.1, 226.9 and 610.5 for Sc1, Sc2, Sc3 and Sc4, respectively. Wheat differential lines: 9260B-173A (9260B), ‘Kyle’, ‘Melita’, HY630, ‘Kenya Farmer’, ‘Lee’, ‘Vista’, ‘Cadillac’. Isolate sampling location: United Kingdom (UK), Alberta (AB), Saskatchewan (SK), Manitoba (MB). Isolate host source: rye (Rye), blackgrass (BG), triticale (Tri), durum wheat (Dur), hexaploid wheat (Wht), oats (Oat), barley (Bar).