Figures & data
Table 1. Oligonucleotide primers used in this study.
Fig. 1 (Colour online) Morphology of Setophoma terrestris isolated from canola roots. Data from strain 2 are presented. (a) Growing on 4% potato dextrose agar (PDA) for 14 days and on 1.7% corn meal agar (CMA) for 37 days. The yellow rectangle frames the area depicted in (b). (b) Microsclerotia (yellow rectangle) and a pycnidium (indicated by an arrow). The inlaid panel is the enlarged view of microsclerotia. (c) Enlarged view of the pycnidium in (b). (d) Conidia released from a pycnidium. (e) Enlarged view of conidia.
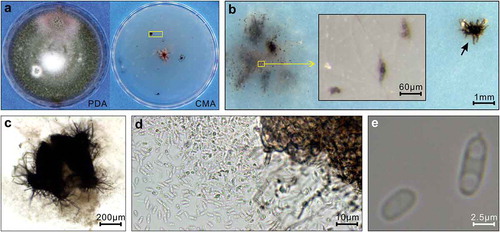
Fig. 2 (Colour online) Infection of canola by Setophoma terrestris isolated from canola roots. Data from strain 2 are presented. (a) Canola plants at 10 days after inoculation (dai). (b) Root symptoms at 10 dai. CK in (a) and (b), control treatment inoculated with autoclaved inoculum; Trt in (a) and (b), inoculated treatment. (c) Infected root with WGA-FITC staining. A hypha growing from the juncture of root cells is indicated by an arrow.
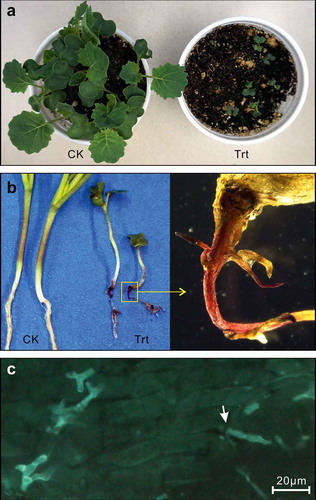
Fig. 3 Pathogenicity of the two Setophoma terrestris strains isolated from canola roots, represented by germination rate and plant height after inoculation. (a) and (c) inoculated with a low-concentration inoculum. (b) and (d) inoculated with a high-concentration inoculum. Trt1 = strain 1 inoculum; CK1 = strain 1 inoculum that has been autoclaved; Trt2 = strain 2 inoculum; CK2 = strain 2 inoculum that has been autoclaved; Grain CK = powder of autoclaved wheat grains; Empty CK = uninoculated control. Means with the same letter do not differ based on Fisher’s LSD test at P ≤ 0.05 (n = 3).