Figures & data
Table 1. Characteristics of tomato production in 100 fields (50 per season) included in the dry and rainy season disease surveys in the Morogoro Region of Tanzania, 2013–2014. Data were obtained by informal interviews of farmers managing each surveyed field.
Fig. 1 Locations of villages included in the tomato disease survey in the Morogoro Region of Tanzania. The Morogoro Region is shaded in grey, with diamonds indicating village locations.
Table 2. Farmer descriptions of tomato diseases in the Morogoro Region of Tanzania. Farmers described tomato diseases and provided a local name for each one. Farmers’ local names for diseases were based on the perceived causal agent, symptoms of the disease, words borrowed from other aspects of life, or the weather. The number of villages that used each naming classification is shown in parentheses.
Table 3. Local names for tomato diseases provided by farmers in response to a survey in the Morogoro Region of Tanzania. The disease(s) to which each name refers and its English translation are shown.
Fig. 2 Farmer-identified key diseases for the rainy and dry growing seasons in the Morogoro Region of Tanzania. Farmers were asked to identify the most important tomato diseases in each growing season (up to five for each season) from a set of pictures of 18 commonly occurring diseases, one abiotic disorder and one insect pest. The percentage of respondents stating each disease is shown.
Table 4. Incidence and severity of tomato diseases during the dry (August–September 2013) and rainy (May–June 2014) seasons in five villages in the Morogoro Region of Tanzania. Disease incidence is shown by village (proportions of fields in each village in which the disease was present) and by field (percentage of diseased plants in fields where disease was present). Foliar disease severity was rated on a 1–4 scale: 1: no disease, 2: >0–25% disease (low severity), 3: >25–50% disease (moderate severity) and 4: >50% disease (high severity). Disease incidence and severity values are means of observations for 10 fields in each village.
Fig. 3 (Colour online) Incidence of tomato diseases in five villages in the Morogoro Region of Tanzania during dry and rainy production seasons. The radius of each circle, semicircle, or sector indicates the number of fields in which the disease was found in each village (max = 10), while circle colour indicates the disease.
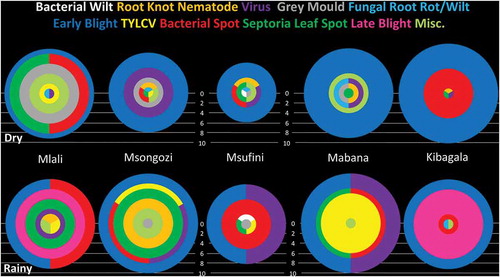
Table 5. Health of tomato seedlings grown in soils collected from 10 tomato fields in each of five villages in the Morogoro region of Tanzania, 2014. Seedlings were rated for root rot and root knot nematode (Meloidogyne spp.) incidence and severity. Shoot dry mass and length and root dry mass were determined.
Fig. 4 Odds ratios for comparisons of root knot nematode presence (A) and density (B) between pairs of villages in the Morogoro Region of Tanzania. Dots indicate estimated odds ratios, while vertical lines indicate the 95% confidence intervals around the point estimates. For those comparisons in which the confidence intervals do not intercept the dotted line, differences between the villages are not significant (P > 0.05). Estimates in A were obtained from the fit of a binary logistic regression model to presence/absence of nematodes data from a soil health assay (see text for details), whereas those in B were estimated through proportional odds logistic regression analysis of nematode gall density data, with 1: < 100 galls per dry g root, 2: 100–500 galls per dry g root, and 3: >500 galls per dry g root.