Figures & data
Table 1. Catechol-induced genes in the Rhizoctonia solani AG-1 IA genome.
Table 2. Primers used for qRT-PCR amplification of melanin biosynthesis genes in R. solani AG-1 IA.
Fig. 1 (Colour online) The size and colouration of mycelial masses of R. solani AG-1 IA cultured in PDB at different concentrations of catechol.
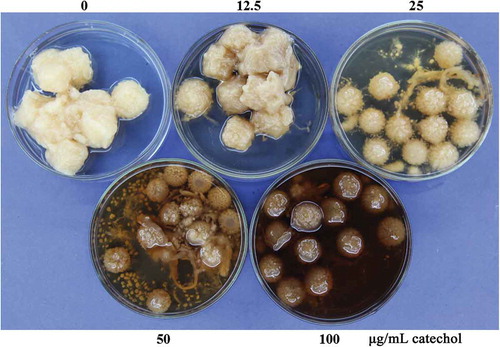
Fig. 2 The growth rates of R. solani AG-1 IA cultured in PDA at different concentrations of catechol. Bars represent the mean ± standard error of three replicates; data with different letters are significantly different (P < 0.05) using Duncan’s multiple range test.
Fig. 3 The effects of different concentrations of catechol on the activities of catalase (CAT), peroxidase (POD) and superoxide dismutase (SOD) in R. solani AG-1 IA. Bars represent the mean ± standard error of three replicates; data with different letters are significantly different (P < 0.05) using Duncan’s multiple range test.
Fig. 4 The effects of different concentrations of catechol on the activities of glutathione S-transferase (GSH-ST), glutathione peroxidase (GSH-PX) and glutathione reductase (GR) in R. solani AG-1 IA. Bars represent the mean ± standard error of three replicates; data with different letters are significantly different (P < 0.05) using Duncan’s multiple range test.
Fig. 5 The gene expression levels of R. solani AG-1 IA cultured in PDA at different concentrations of catechol. All gene expression levels were assessed using quantitative real-time PCR analysis and normalized to the housekeeping gene GPD. Bars indicate standard error. *P < 0.05 as compared with the control.
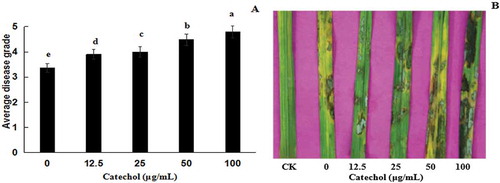
Fig. 6 (Colour online) Virulence of Rhizoctonia solani AG-1 IA cultured in different concentrations of catechol on detached rice leaves. (a) Disease grades of R. solani AG-1 IA on rice leaves. Bars represent the mean ± standard error of three replicates; data with different letters are significantly different (P < 0.05) using Duncan’s multiple range test. (b) Disease phenotypes of R. solani AG-1 IA on rice leaves. CK: PDA (no strain); 0, 12.5, 25, 50 and 100 represent the strain cultured on PDA plates containing 0, 12.5, 25, 50 and 100 μg mL−1 catechol, respectively.