Figures & data
Fig. 1 (Colour online) (a) Healthy fresh flower bud of Cannabis sativa (marijuana) harvested 10 weeks into the production cycle that was used for inoculation studies; (b) Dried mature flower buds at harvest; (c) Recovery of B. cinerea from naturally infected flower buds; (d) Symptoms of necrosis due to botrytis bud rot following artificial inoculation; (e) Penicillium species recovered from cannabis buds – (left) P. olsonii, (right) P. copticola; (f) Extensive colonization of flower bud by P. olsonii; (g) Slight necrosis following inoculation with P. copticola (right) compared with control (left); (h) Recovery of P. copticola from cannabis stem and petiole segments following surface-sterilization with sodium hypochlorite.
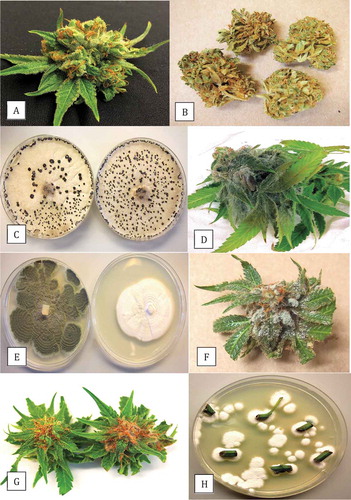
Table 1. Extent of decay on cannabis flower buds following inoculation with six fungal species recovered from Cannabis sativa.
Fig. 2 Scanning electron microscopy images of the development of Penicillium olsonii (a–d) and Fusarium oxysporum (e, f) on cannabis bud tissues following inoculation. (a) Conidiophores of P. olsonii (arrow) developing on the surface of the bract tissue; (b) Close-up of conidiophore (arrow) showing characteristic chains of spores of Penicillium produced from phialdes; (c) Spore chains stuck to the surface of stigmatic hairs (arrow); (d) Close-up of chains of spores; (e) Mycelium of F. oxysporum growing over surface of the bract tissues of buds; (f) Microconidia produced in clusters (arrow) on the bract tissue.
Fig. 3 (Colour online) Colony morphology on PDA and results from pathogenicity tests of Fusarium spp. recovered from cannabis buds. (a, b) F. solani; (c, d) F. oxysporum; (e, f) F. equiseti. Photographs of inoculated buds were taken after 7 days of incubation at 23°C.
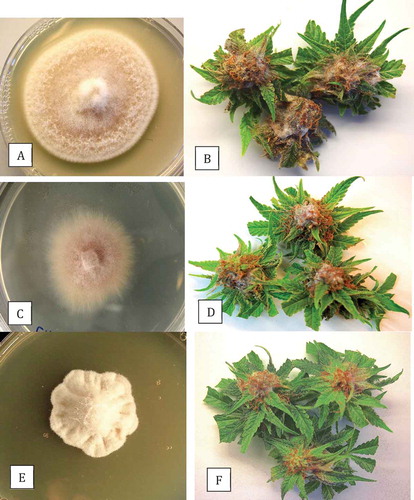
Fig. 4 Phylogenetic tree of Fusarium solani isolates originating from diseased cannabis roots (BC-1, BC-2, from a previous study) and cannabis buds (BC-3, BC-4, present study) using ITS1-5.8S-ITS2 sequences compared with 13 isolates from a range of geographic regions worldwide (GenBank numbers are shown). A bootstrap consensus tree was inferred from 1000 replicates to represent the distance using the neighbour-joining (NJ) method. Branches corresponding to partitions reproduced in less than 50% bootstrap replicates were collapsed. Sclerotinia sclerotiorum was used as an outgroup. The scale bar indicates the expected number of nucleotide substitutions.
Fig. 5 (Colour online) Symptoms and development over time of powdery mildew on cannabis leaves. (a, b) Young leaves; (c, d) Mature leaves. Characteristic white mycelium and sporulation are evident.
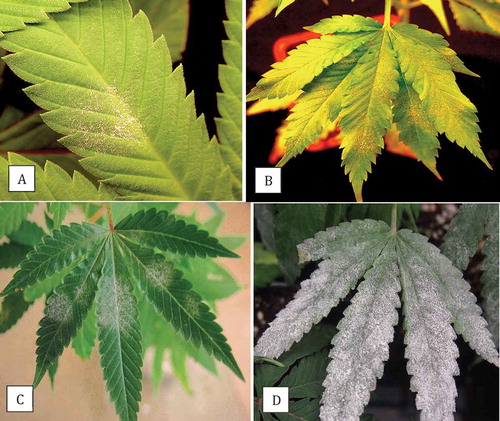
Fig. 6 Scanning electron microscopy observations of the development of powdery mildew on cannabis buds. (a, b) Mycelium and conidiophores; (c, d, e) Conidial production; (f) Conidial germination; (g) Conidia and conidiophores on the bract surface and adherence of conidia to the surface of a trichome. Arrows show conidiophore (b), mycelium (c) and glandular trichome head (g).
Fig. 7 Phylogenetic tree of Golovinomyces species originating from cannabis (BC-1, BC-2) compared to those of other plant species using ITS1-5.8S-ITS2 sequences (GenBank numbers are shown). Golovinomyces cichoracearum could not be resolved using the ITS region from G. ambrosiae from sunflower and giant ragweed or G. spadiceus from dahlia. The scale bar indicates the expected number of nucleotide substitutions.