
Figures & data
Table 1. Description of the visual rating scale (1–7) used to assess root rot incidence and severity in laboratory assessments (slightly modified from Bilgi et al., Citation2008).
Table 2. Description of the primer sequences (with references) used to identify individual root rot pathogens.
Table 3. Total rainfall (mm) from May–August each year relative to the 30-year long-term average (LTA) at locations in the brown, dark brown and black soil zones on the Canadian prairies, 2014–2017.
Fig. 1. (Colour online) Root rot symptoms: (a) severe root decay and shoot death of pea caused by A. euteiches; (b) vascular reddening and blackening of tap root caused by Fusarium spp.; (c) honey-brown discolouration and epicotyl pinching caused by A. euteiches; (d) lentil roots showing, from left to right, healthy, moderate and severe root symptoms; (e) early season symptoms of Aphanomyces root rot on pea shoots causing yellowing and stunting in 2017; (f) yellowing patches developing after a mid-July rainfall in 2015; (g) pea field showing severe yield loss on one half, and patchy distribution along depressions and water tracks on the other half in 2014.
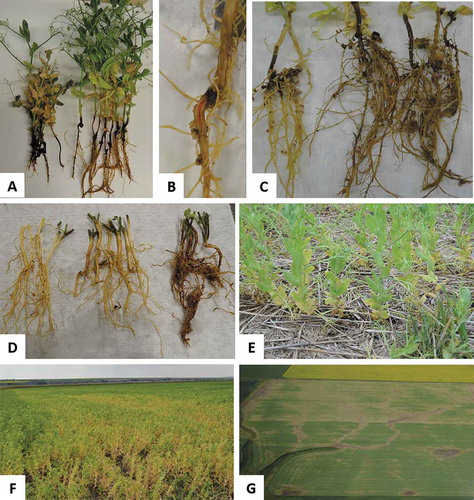
Table 4. Number of fields surveyed, and mean root rot incidence (at damaging levels, DI > 3) and severity, of pea and lentil fields in Alberta, Saskatchewan and Manitoba, 2014–2017.
Fig. 2. (Colour online) Average root rot severity of each pea or lentil crops surveyed in Alberta (2014–2017), Saskatchewan (2015–2017) and Manitoba (2016–2017).
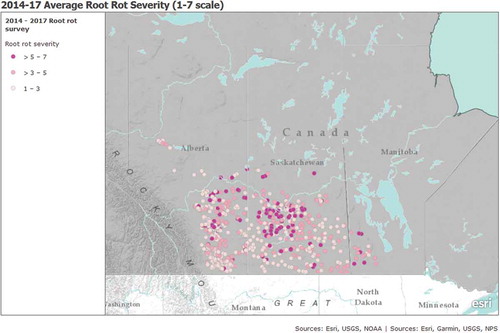
Fig. 3. (Colour online) Aphanomyces euteiches incidence and per cent positive samples (sites) based on PCR assays from diseased root tissues, within pea and lentil crops in Alberta (2014–2017), Saskatchewan (2015–2017) and Manitoba (2016–2017).
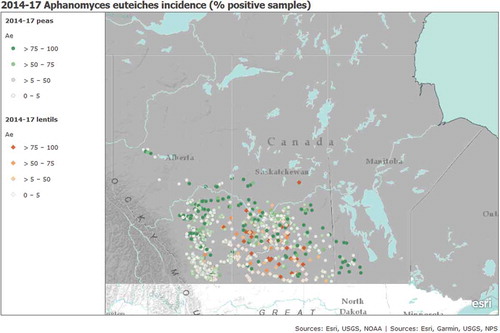
Fig. 4. Per cent fields and samples (sites) testing positive for Aphanomyces euteiches, based on PCR assays from diseased root tissues, and total precipitation over the growing season (May–August) in (a) Alberta pea; (b) Alberta lentil; (c) Saskatchewan pea; (d) Saskatchewan lentil; and (e) Manitoba pea crops in their respective years surveyed. Error bars represent standard error of the mean.
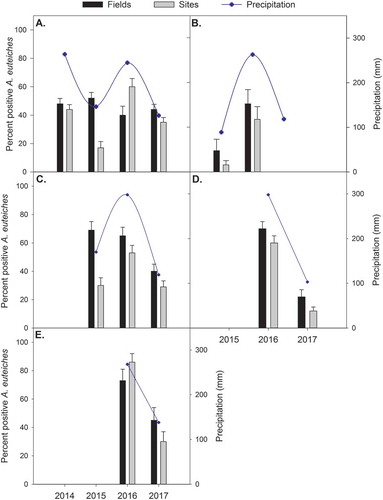
Fig. 5. The proportion of (a) Alberta pea; (b) Saskatchewan pea; (c) Alberta lentil and (d) Saskatchewan lentil fields in each category, based on the % samples from each field that tested positive for Aphanomyces euteiches in PCR analyses, 2014–2017 (NB only includes fields with root rot severity ratings > 3).
Fig. 6. Per cent fields testing positive for important Fusarium spp., based on PCR assays from diseased root tissues, in (a) Alberta pea; (b) Alberta lentil; (c) Saskatchewan pea; (d) Saskatchewan lentil; and (e) Manitoba pea crops in their respective years surveyed. Error bars represent standard error of the mean.

Fig. 7. Per cent of pea and lentil fields and samples (sites) that were positive for either A. euteiches and F. avenaceum and/or F. solani (Ae+ Fus); F. avenaceum and/or F. solani (Fus only); or A. euteiches (Ae only).
Table 5. Frequency of identification of specific root rot pathogens based on assessment using culturing versus multiplex PCR, based on comparison of results from a subset of surveyed fields. Five fields in each year were chosen that had visible healthy and diseased patches, and were within 100 km of research centres.
Table 6. Number of fields, mean root rot incidence (at damaging levels, DI > 3), severity (Sev), and per cent of fields positive for Aphanomyces euteiches (Ae), based on PCR assays from diseased root tissues, in Alberta in alfalfa, faba bean and dry bean fields surveyed in 2015–2017.