Figures & data
Table 1. Primers, probe and PCR conditions for the identification of P. c. subsp. carotovorum in this study.
Fig. 1 Distribution of Pectobacterium carotovorum subsp. carotovorum (Pcc) in the Mediterranean coast of Turkey. (a) Map of Turkey, (b) Banana-producing areas in Turkey, (c) Survey areas in Anamur province. The asterisks indicate the specific locations of the wet rot disease detected.
Fig. 2 (Colour online) Symptoms of banana wet rot disease: (a) swollen and split suckers, (b) cut section of the disease portion showing internal symptoms, (c) advanced stage of wet rot disease, (d) advanced internal necrotic lesion.
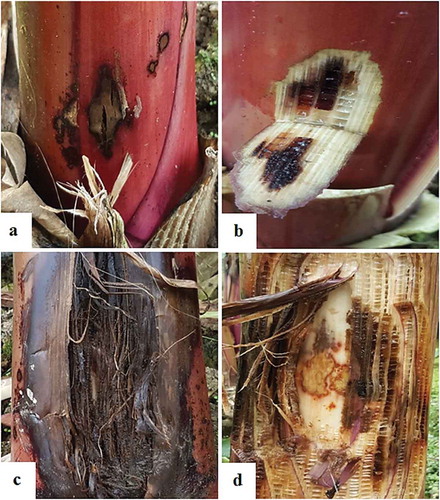
Fig. 3 (Colour online) Symptoms of banana wet rot disease: (a) collar wet rot, (b) wet rot in the middle of the pseudo-stem, (c) pseudo-stem tip over in young banana plant, (d) leaf yellowing and tip over in the matured plant.
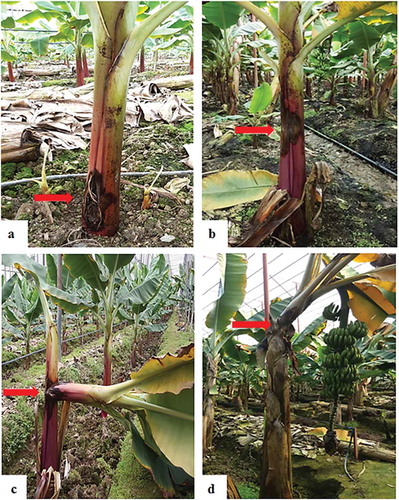
Fig. 4 (Colour online) Pathogenicity of Pcc on banana plants (Grand Naine): (a) healthy plant inoculated with water, (b) 2 weeks after inoculation, (c) 3 weeks after inoculation, (d) 4 weeks after inoculation. The plants were inoculated with different bacterial concentrations (cfu mL−1): 1 = 106, 2 = 107, 3 = 108 (e) death of the pseudostem.
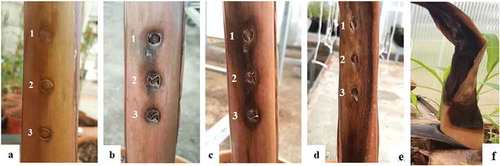
Fig. 5 Agarose gel (1.5%) of the PCR products of Pcc strains on banana with primer pairs (a) fD1/rP2 based on 16S rDNA, (b) INPCCF/INPCCR based on pel gene. M – 100 bp DNA ladder; Lanes: 1–41; Pcc 1 – Pcc 41, Lane: 42; Positive control (DSM-30 168), Lane: 43; Negative control, respectively.
Fig. 6 (Colour online) Real-time PCR detection of Pcc isolates using the LNA probe. (a) DSM-30 168 = positive control, HBPcc2 = positive control, DSM-4610 = D. chrysanthemi, DSM-50 259 = P. cichorii, HBPcc4 = Banana Pcc isolate (b) HBPcc-1-HBPcc15 = Pcc banana isolates (c) HBPcc-16-HBPcc30 = Pcc banana isolates. (d) HBPcc-31-HBPcc41 = Pcc banana isolates, DSM-30 168 = positive control.
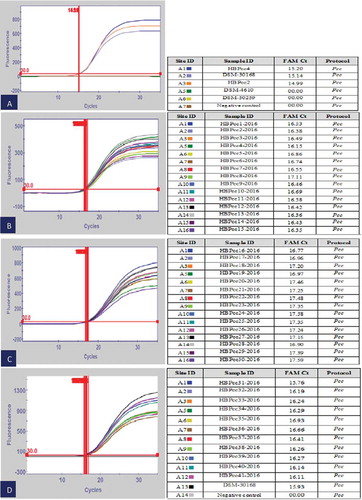
Fig. 7 (Colour online) Real-time PCR detection of Pcc from macerated banana plant tissue using LNA probe. DSM-30 168 = positive control.
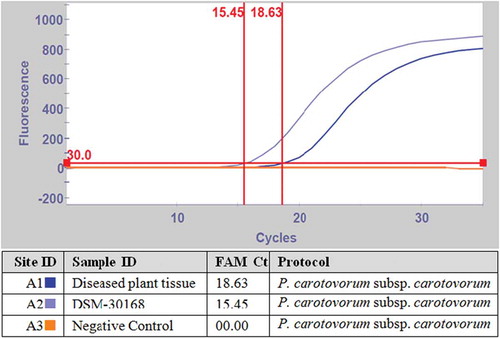
Fig. 8 Maximum likelihood tree showing the phylogenetic relationship between the Turkish isolates and other strains from NCBI GenBank based on pel gene. Bootstrap values (expressed as percentages of 1000 replications) are shown at the nodes.
Fig. 9 Maximum likelihood tree showing the phylogenetic relationship between the Turkish isolate and other strains from NCBI GenBank based on 16S rDNA. Bootstrap values (expressed as percentages of 1000 replications) are shown at the nodes.