Figures & data
Fig. 1 (Colour online) Cell wall mediated penetration resistance associated with papilla formation in barley leaves inoculated with non-host wheat powdery mildew fungus, Blumeria graminis f. sp. tritici (Bgt). (A) Barley leaf epidermis 48 hours post inoculation with Bgt stained with aniline blue (pH 5.0) and viewed under light microscopy. (B) The callose fluorescence at the Bgt-attempted penetration site of fixed and aniline blue-stained (pH 9.5) barley leaf viewed with fluorescence microscopy (app – appressorium, pap – papilla and ha – halo).
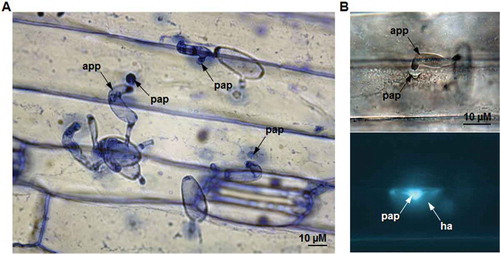
Table 1. The differential FTIR spectra and their assignment over the cell-wall components of inoculated (with papillae) and non-inoculated leaves based on a multivariate analysis.
Fig. 2 (Colour online) The mid-infrared spectra of the epidermal layer from barley leaves inoculated (with papillae) and not inoculated with B. graminis f. sp. tritici, respectively.
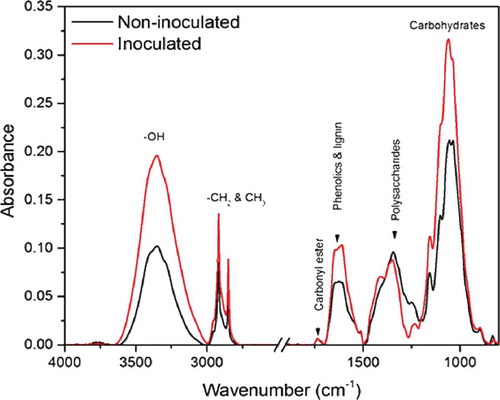
Fig. 3 (Colour online) Integrated absorption bands of lipids acyl chain (3000–2750 cm−1), phenolics/lignin (1720–1500 cm−1), polysaccharides (1500-1250 cm−1), and carbohydrates (1200–900 cm−1) in synchrotron-based FTIR (sFTIR) spectra of epidermal layer from a barley leaf inoculated with B. graminis f. sp. tritici and non-inoculated leaf samples. Letters indicate the statistical differences between the treatments (LSD, P ≤0.05).
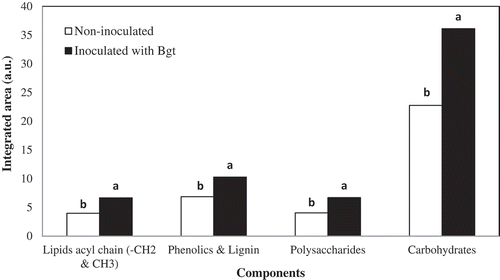
Fig. 4 (Colour online) Increases in the content of glucan polymers (1140–1080 cm−1) in barley leaves inoculated with B. graminis f. sp. tritici (Bgt) compared to non-inoculated leaf samples. The content of epidermal layer was shown for non-inoculated (A) and inoculated (B) barley leaves, and the band for integrated area of b-1,3-glucan polymers is shown in C where different letters indicate significant changes (LSD, P ≤ 0.05). The arrows in B highlight a moderate degree of changes in composition (green color) from control (non-sprayed), whereas minimum change (blue) was shown for non-inoculated samples. The scale bar = 50 µM.
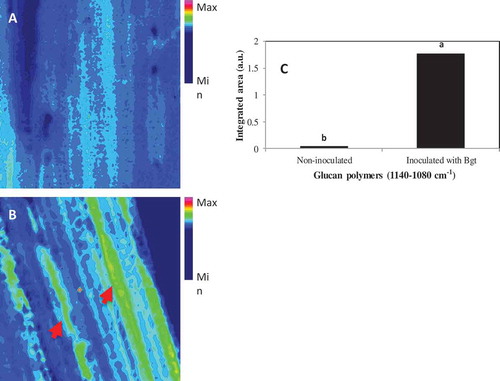
Fig. 5 (Colour online) Principal component analyses of the mid infrared spectra of the epidermal cells of barley leaves inoculated (with papilla) and not inoculated (water) with the powdery mildew fungus B. graminis f. sp. tritici.
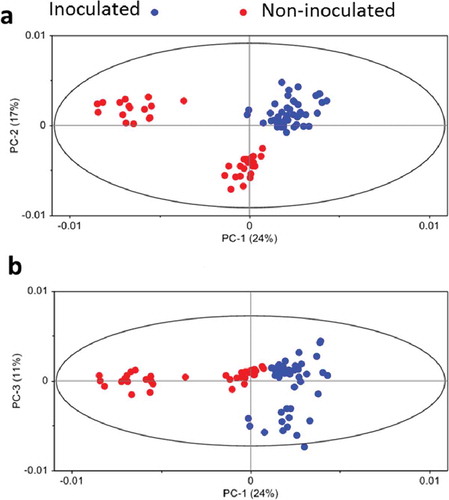
Fig. 6 (Colour online) Loadings plot (PC1 & PC2) of epidermal cells of barley leaves based on sFTIR spectra for both lipids (a) and fingerprint (b & c) regions. Each point in the plot represents the projection of a spectrum in the PC1–PC2 space.
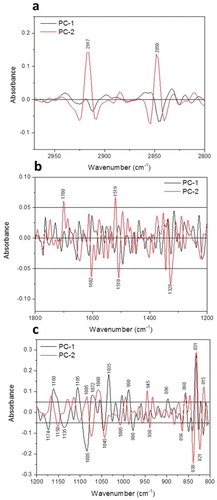
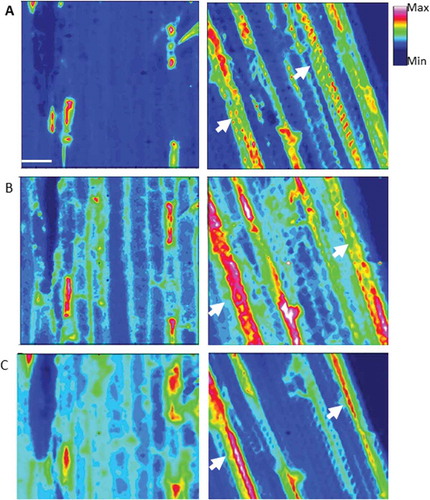
Fig. 7 (Colour online) Focal plane array (FPA) images identifying chemical distribution in the full range of spectrum (A), aliphatic lipids (3000–2750 cm−1, B) and fingerprint (1800–900 cm−1, C) regions in epidermal cells of barley leaves (abaxial side) inoculated and non-inoculated (water) with B. graminis f. sp. tritici. The arrows highlight the changes in composition from control (non-inoculated).