Figures & data
Table 1. Geographic origins and number of Alternaria isolates obtained from infected sunflower leaves collected in Beijing, China.
Fig. 1 (Colour online) Symptoms of sunflower leaf blight and morphologies of the causal fungi, Alternaria tenuissima and A. alternata. (a), Necrotic flecks and chlorotic lesions on diseased sunflower leaves. (b, d, f), Colonies, sporulation patterns and conidia of the representative isolates of Alternaria tenuissima. (c, e, g), Colonies, sporulation patterns and conidia of the representative isolates of A. alternata. (h–j), Pathogenicity of the representative isolates of A. tenuissima on detached sunflower leaves. (k–m), Pathogenicity of the representative isolates of A. alternata on detached sunflower leaves.
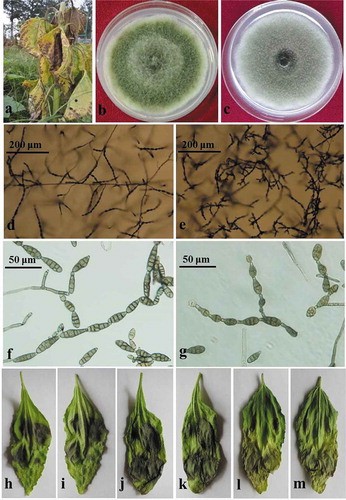
Table 2. Disease incidence and disease index of four isolates of Alternaria tenuissima and six isolates of A. alternata on detached sunflower leaves.
Fig. 2 Phylogenetic tree based on the partial coding sequences of histone 3 genes of four A. tenuissima isolates, six A. alternata isolates and three reference sequences retrieved from GenBank. The tree was constructed by neighbour-joining using the Kimura two-parameter distance method. Bootstrap values (in percentage) above 70 from 1000 pseudo-replicates are shown for major lineages within the tree. The marker denotes a measurement of relative phylogenetic distance. Alternaria infectoria was used as an outgroup.
Fig. 3 Phylogenetic tree based on the sequences of the ITS region of rDNA of four A. tenuissima isolates, six A. alternata isolates, and three reference sequences retrieved from GenBank. The tree was constructed by neighbour-joining using the Kimura two-parameter distance method. Bootstrap values (in percentage) above 70 from 1000 pseudo-replicates are shown for major lineages within the tree. The marker denotes a measurement of relative phylogenetic distance. Alternaria infectoria was used as an outgroup.