
Figures & data
Fig. 1. Percentage of Canada Western Red Spring (CWRS) and Canada Western Amber Durum (CWAD) producer submitted harvest samples downgraded due to Fusarium damage (FUS DMG). Note that in 2010 the grading tolerances for Fusarium damage in CWRS were made more stringent.
Table 1. Mycotoxin analytes and limits of quantitation (LOQ).
Fig. 2. Crop regions (CR) of western Canada.
Fig. 3. (Colour Online)Relationships between deoxynivalenol (DON) and Fusarium damage in Canada Western Red Spring (CWRS), Canada Western Amber Durum (CWAD) and Canada Eastern Soft Red Winter (CESRW) observed for different years of harvest. Regression equation parameters for the relationships shown in the figure are listed in .
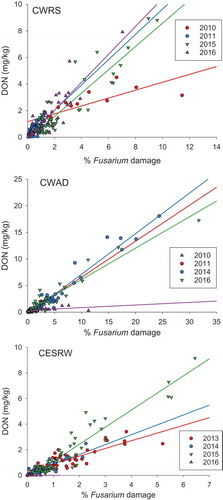
Table 2. Mycotoxins quantified in Canada Western Amber Durum 2013–2016 harvest sample composites. Samples include both grade and regional composites.
Table 3. Mycotoxins quantified in Canada Western Red Spring 2013–2016 harvest sample composites. Samples include both grade and regional composites.
Table 4. DON (mg kg−1) in harvest sample grade composites of Canada Western Amber Durum (CWAD).
Table 5. DON (mg kg−1) in regional composites of Canada Western Red Spring (CWRS).
Table 6. DON and % Fusarium damage linear relationship parameters for various harvest years.