Figures & data
Fig. 1 (Colour online) Yearly incidence of wheat stem base disease. Different letters denote statistical differences at α = 0.05.
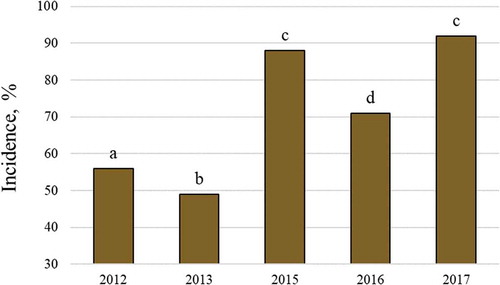
Fig. 2 (Colour online) Incidence of wheat stem base disease with regard to crop sequence and soil tillage conditions (2012–2017 average, with the exception of 2014). W-W, continuous wheat; OR-W, oilseed rape, wheat, wheat; CR, oilseed rape, barley, faba beans and wheat. Different letters denote statistical differences at α = 0.05.
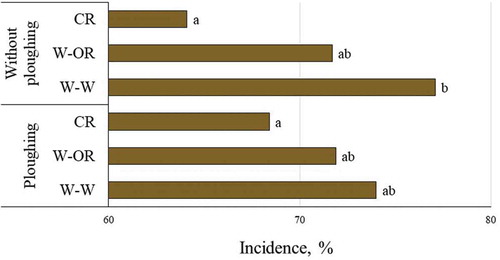
Fig. 3 Guilds of fungi isolated with visible symptoms of stem base disease in wheat. A, causal agents of stem base diseases; B, causal agents of other diseases; C, saprotrophs; D, other fungi.
Fig. 4 Relative density (%) of causal agents of wheat stem base diseases on a yearly basis.