
Figures & data
Fig. 1 Inhibitory effect of P. fluorescens isolates 1–112, 2–28 and 4–6 on mycelial growth of B. cinerea on ¼ TSA-PDA amended with no chemicals (NC) or amended with calcium chloride (CaCl2), sodium bicarbonate (SBC) or salicylic acid (SA) after 72 h incubation at 25°C. Data represent the mean ± standard error from two independent experiments. Means followed by a common letter are not significantly different according to Tukey’s test (P < 0.05). ![]()
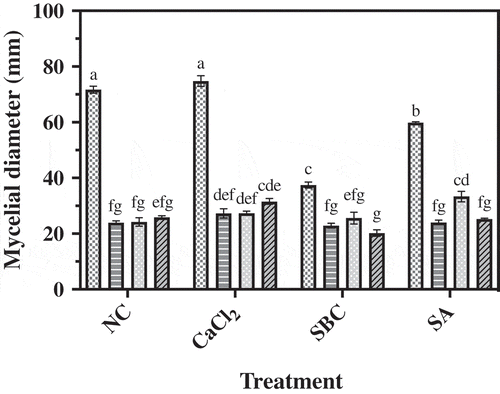
Fig. 2 Inhibitory effect of P. fluorescens isolates 1–112, 2–28 and 4–6 on mycelial growth of M. piriformis on ¼ TSA-PDA amended with no chemicals (NC) or amended with calcium chloride (CaCl2), sodium bicarbonate (SBC) or salicylic acid (SA) after 72 h incubation at 25°C. Data represent the mean of three replicates ± standard error. Means followed by a common letter are not significantly different according to Tukey’s test (P < 0.05). ![]()
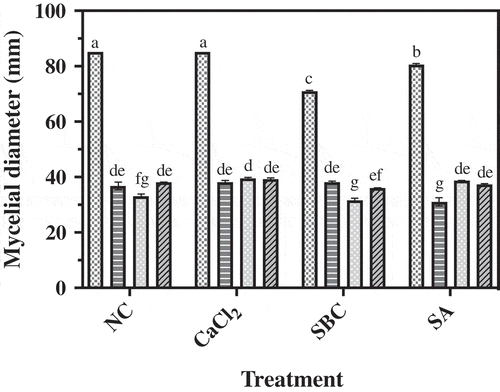
Fig. 3 Inhibitory effect of P. fluorescens isolates 1–112, 2–28 and 4–6 on mycelial growth of P. expansum on ¼ TSA-PDA amended with no chemicals (NC) or amended with calcium chloride (CaCl2), sodium bicarbonate (SBC) or salicylic acid (SA) after 72 h incubation at 25°C. Data represent the mean of three replicates ± standard error. Means followed by a common letter are not significantly different according to Tukey’s test (P < 0.05). ![]()
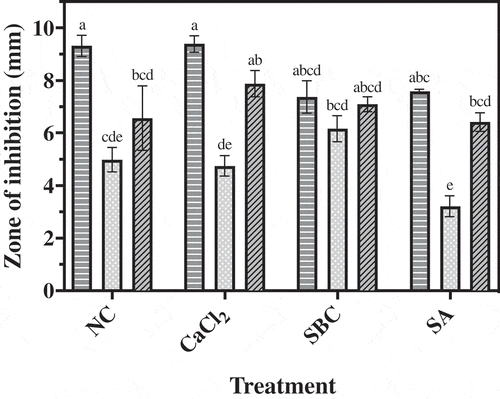
Fig. 4 Grey mould (a) lesion diameter and (b) disease incidence of ‘Ambrosia’ apples after 15 weeks in commercial controlled atmosphere storage at 0°C. Apples treated with B. cinerea were also subjected to treatment with each isolate of P. fluorescens, 1–112, 2–28 or 4–6, or BioSave® or Scholar®. Control apples were treated with the pathogen only. Each bar represents the mean of three replicates of 10 apples each ± standard error. Different letters indicate significant differences according to Tukey’s test (P < 0.05).
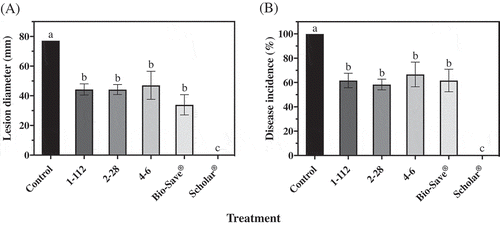
Fig. 5 Mucor rot (a) lesion diameter and (b) disease incidence of ‘Ambrosia’ apples after 15 weeks in commercial controlled atmosphere storage at 0°C. Apples treated with M. piriformis were also subjected to treatment with each isolate of P. fluorescens, 1–112, 2–28 or 4–6, or BioSave® or Scholar®. Control apples were treated with the pathogen only. Each bar represents the mean of three replicates of 10 apples each ± standard error. Different letters indicate significant differences according to Tukey’s test (P < 0.05).
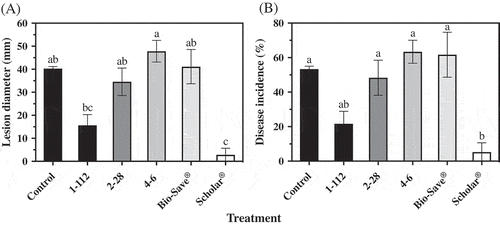
Fig. 6 Blue mould (a) lesion diameter and (b) disease incidence of ‘Ambrosia’ apples after 10 weeks in commercial controlled atmosphere storage at 0°C. Apples treated with P. expansum were also subjected to treatment with each isolate of P. fluorescens, 1–112, 2–28 or 4–6, or BioSave® or Scholar®. Control apples were treated with the pathogen only. Each bar represents the mean of three replicates of 10 apples each ± standard error. Different letters indicate significant differences according to Tukey’s test (P < 0.05).
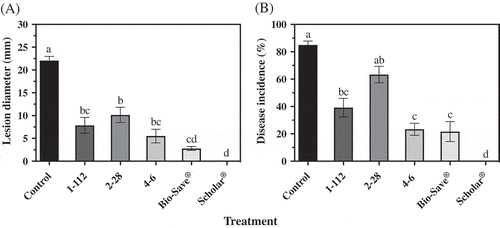
Table 1. Effect of P. fluorescens isolate 4–6 alone or in combination with calcium chloride (CaCl2), sodium bicarbonate (SBC) or salicylic acid (SA) in comparison to the registered biological control agent, BioSave® and fungicide, Scholar® on the lesion diameter of B. cinerea, M. piriformis and P. expansum on ‘Ambrosia‘ apples.
Table 2. Effect of P. fluorescens isolate 4–6 alone or in combination with calcium chloride (CaCl2), sodium bicarbonate (SBC) or salicylic acid (SA) in comparison to the registered biological control agent, BioSave® and fungicide, Scholar® on the disease incidence of B. cinerea, M. piriformis and P. expansum on ‘Ambrosia‘ apples.