Figures & data
Fig. 1 Pathogenicity of three fungal pathogens on peaches estimated by measurement of lesion diameter (cm) at 27 ± 2°C after 7 days of incubation. The F value represents the result of a one-way ANOVA. Different letters indicate significant differences in the means at LSD (P < 0.05). Bars represent the standard error (n = 10).
Fig. 2 (Colour online) Rot appearance on peach fruit infected with each of three fungal pathogens after 7 days of incubation at 27 ± 2°C. The infection started as soft soaked brown areas on the fruit, followed by fungal spread into healthy portions and the subsequent appearance of heavy mycelium on infected areas.
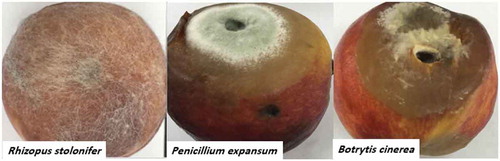
Fig. 3 Effect of essential oil formulations on the growth of fungal pathogens in vitro at 27 ± 2°C after 6 days of incubation. Vertical bars indicate the standard error of the mean (N = 5). F-values represent two-way ANOVA results, ***: P < 0.001.
Fig. 4 Effect of essential oil formulations on disease incidence (%) and disease severity (%) caused by three fungal pathogens on peaches stored under different temperatures, after 7 days of incubation. Vertical bars indicate the standard error of the mean (N = 15). F-values represent two-way ANOVA results, ***: P < 0.001, **: P < 0.01, *: P < 0.05, ns: not significant.
Fig. 5 Effect of essential oil formulations on disease severity and incidence caused by three fungal pathogens on peaches kept under cold storage (4°C) for up to 30 days in vivo. Vertical bars indicate the standard error of the mean (N = 15). F-values represent two-way ANOVA results, ***: P < 0.001.
Fig. 6 Effect of essential oil formulations on weight loss (%) of peaches infected with fungal pathogens and kept under cold storage (4ºC) for up to 30 days in vivo. Vertical bars indicate the standard error of the mean (N = 15). F-values represent the two-way ANOVA results, ***: P < 0.001.
Fig. 7 Scanning electron micrographs of hyphae of three fungal pathogens treated with a peppermint essential oil formulation with Arabic gum and Tween 20 (Mint-T-G) at a concentration of 1 mL L−1. Botrytis cinerea (a–c), Penicillium expansum (d–f), and Rhizopus stolonifera (g–i). The untreated hyphae (control) show well-developed inflated cells having normal smooth walls (a, d, and g). The treated hyphae showing plasmolysis, distortion, squashed appearance and complete collapse (b, c, e, f, h, and i).