Figures & data
Fig. 1 PCR amplification products from 20 Xanthomonas campestris pv. campestris (Xcc) strains in a species-specific PCR assay and race 4 specific molecular markers. (a), (b) and (c): Three amplicons (370, 441 and 619 bp) from all 20 strains in the PCR assay; (d): Amplicons (462 bp) obtained with Xcc-Race 4 specific molecular markers from all 20 strains. Lanes 1–20: 20 Xcc strains (the corresponding strains, host and sampling location for each lanes are included in Supplementary Table 1)
Fig. 2 Black rot symptoms on the Brassica oleracea lines QP07 and DBP71 infected by Xanthomonas campestris pv. campestris (Xcc) at 0, 2, 3, 7, and 14 days (left to right) following inoculation with Xcc. The black rot symptoms are marked by red arrows
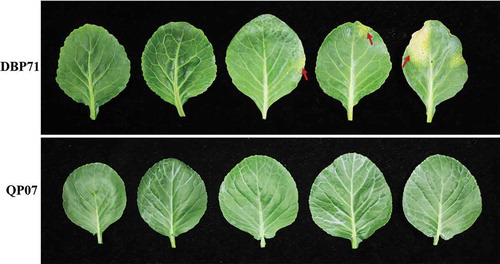
Fig. 3 Number of differentially expressed genes in the Brassica oleracea line QP07 (a) up-regulated or (b) down-regulated (|log2 (fold change)| ≥1 and the FDR < 0.01) compared with DBP71. Numerals inside the parentheses indicate the number of genes expressed at each time-point. The total number of DEGs is noted at the bottom of each Venn diagram. hpi, h post-inoculation
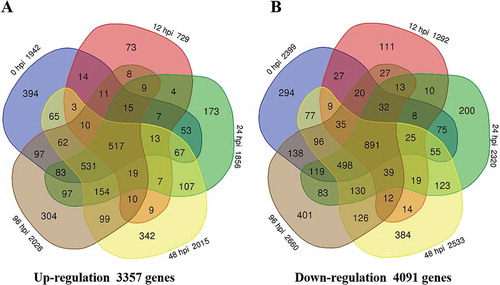
Table 1. Top 10 Gene Ontology (GO) terms (biological process) that were significantly enriched at five time-points after inoculation of Brassica oleracea with Xanthomonas campestris pv. campestris.
Fig. 4 GO assignment of the differentially expressed genes (DEGs) in Brassica oleracea lines QP07 and DBP71. The unigenes were assigned to three main categories: cellular component (a), molecular function (b), and biological process (c). The x-axis indicates the number of annotated DEGs. hpi, h post-inoculation
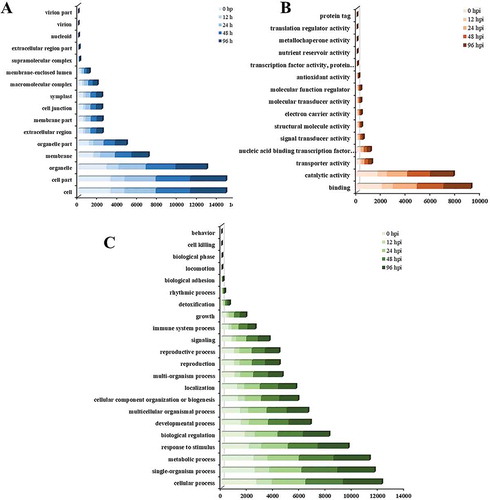
Fig. 5 Validation of the gene expression patterns of selected genes identified via RNA sequencing using qRT-PCR analysis. The y-axis shows the fold-change between the two lines