Figures & data
Table 1. Descriptions of the parents that were used for hybrid production including Fusiarum head blight (FHB) resistance alleles, year of cultivar release, pedigree, and developing institution
Table 2. Combined analysis of variance across the four environments (PRO 18, LANG 19, PRO 19, SAB 19) for four Fusarium head blight (FHB) resistance-related traits (FHB Index, Fusarium Damaged Kernels, DON concentration, DISK score)
Table 3. Least square means and least significant difference (LSD) mean separation for the four response traits (Fusarium head blight (FHB) Index, Fusarium Damaged Kernels, DON concentration, DISK score) of the 11 genotypes included in this study, across all four locations
Table 4. Contrast analyses of hybrid genotypes with the resistant, susceptible, and mid-parent value for the four Fusarium head blight (FHB) resistance-related traits, by location and combined across locations
Fig. 1 Cluster analysis using Ward’s minimum variance method to organize the eleven genotypes into three clusters based on the FHB Index, Fusarium Damaged Kernels, DON concentration, and DISK score, across the four environments
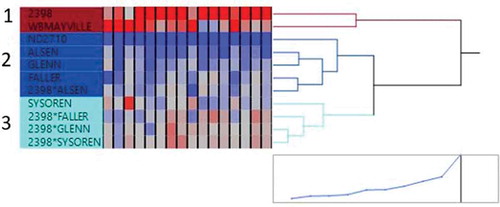
Table 5. Mean and standard deviation of wheat genotypes grouped under the three clusters created using four Fusarium head blight (FHB) resistance-related traits (FHB Index, Fusarium Damaged Kernels (FDK), DON concentration and DISK score)
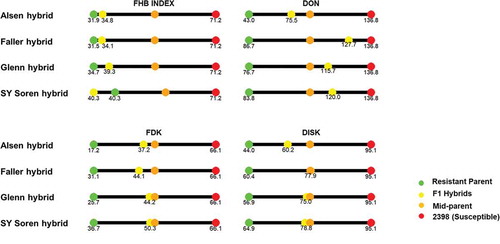
Fig. 2 FHB Index, Fusarium Damaged Kernels, DON concentration and DISK score of four F1 hybrids, their moderately resistant parent, the susceptible parent (‘2398’), and mid-parent value, across four environments