Figures & data
Fig. 1 Microscopic images of leaf tissues after spray-inoculation with a GFP-tagged strain of Dickeya solani, or mock-inoculated. Green fluorescent bacterial cells or signals in the images are indicated with an arrow. (a) Confocal laser scanning microscopy (CLSM) image of a stoma on the adaxial side of an inoculated potato leaf. (b) Mock-inoculated. Leaflets sampled at 1 day after inoculation, were incubated overnight on water agar at 25°C prior to observation. Photomicrographs were taken with a 40x (a) or 10× (b) objective lens. (c) Epifluorescence stereomicroscopy (ESM) image of a stoma on the adaxial side of an inoculated potato leaf. (d) Mock-inoculated. Leaflets were sampled 7 days after inoculation and incubated on water agar for 2 days at 25°C to support bacterial growth. Photomicrographs were taken with a 20× (c) or 40× (d) objective lens. (e) CLSM image of a hydathode of an inoculated potato leaf. (f) Mock-inoculated. Leaflets sampled at 0 dpi were placed on water agar and incubated overnight at 25°C prior to observation. Photomicrographs were taken with a 40× objective lens. (g) CLSM image of vascular tissue of the abaxial side of an inoculated potato leaf. (h) Mock-inoculated. Photomicrographs were taken with a 10× objective lens 7 days after inoculation. (i and j) ESM images of the adaxial side of wounded potato leaf tissue. Leaflets were collected shortly after leaf inoculation, placed on water agar and incubated overnight at 25°C prior to observation. Notice the striped pattern of the infected tissues consistent with the striped pattern of the superficial wounds at the time of inoculation. Photomicrographs were taken with a zoom magnification objective at 10×
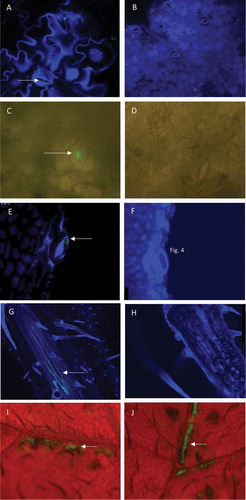
Table 1. Progress of soft rot Pectobacteriaceae colonization process1 in wounded leaves during the 2013 and 2014 systemic colonization experiments
Fig. 2 Population densities of Dickeya solani and Pectobacterium parmentieri (respectively, the upper and lower row of graphs) in leaves at 0, 1, 21 and 42 days after spraying potato leaves with suspensions of 102, 104 or 106 cfu mL−1. Results are summarized of the glasshouse experiment in 2013. W = leaves wounded prior to inoculation, NW = leaves not wounded prior to inoculation, D = leaves disinfected prior to analysis, ND = leaves not disinfected prior to analysis. Error bars show standard deviations
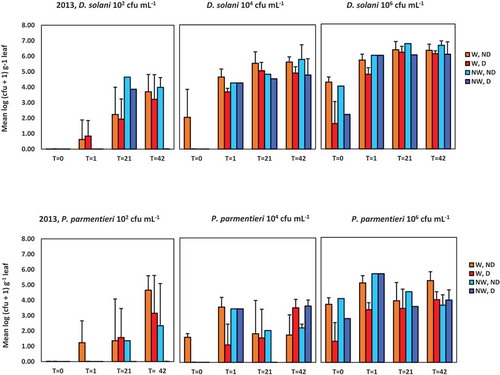
Fig. 3 Population densities of Dickeya solani and Pectobacterium parmentieri (respectively, the upper and lower row of graphs) in leaves at 0, 1, 21 and 35 days after spraying potato leaves with suspensions of 102, 104 and 106 cfu mL−1. Results are summarized of the glasshouse experiment in 2014. W = leaves wounded prior to inoculation, NW = leaves not wounded prior to inoculation, D = leaves disinfected prior to analysis, ND = leaves not disinfected prior to analysis. Error bars show standard deviations
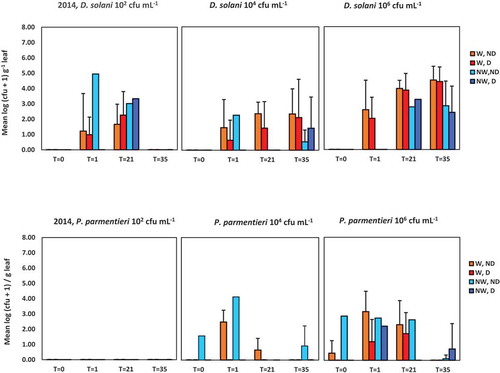
Fig. 4 Average densities of Dickeya solani and Pectobacterium parmentieri (respectively, the upper and lower row of graphs) in leaves, in top or base parts of potato stems, in stolons or in tubers at 42 days post-inoculation in the experiment conducted in 2013. Bars indicate standard deviations. Plants were inoculated with 102, 104 or 106 cfu mL−1 of Dickeya solani or Pectobacterium parmentieri on leaves that were wounded or not wounded prior to inoculation
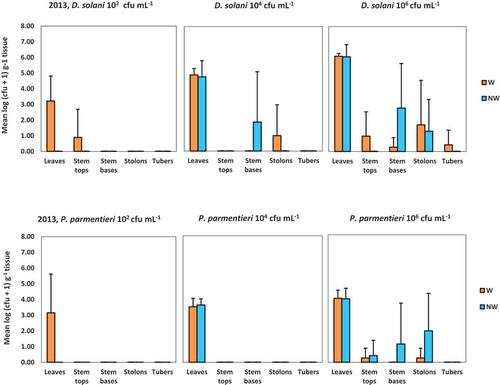
Fig. 5 Population densities of Dickeya solani (Dsol) and Pectobacterium parmentieri (Ppar) in foliage tissue at 0, 3, 5 and 14 days after chopping the haulms followed by herbicide treatment of the stalks (Mech.) or after chemical vine killing (Chem.). Haulms were spray-inoculated with 108 cfu mL−1 5 days before haulm destruction
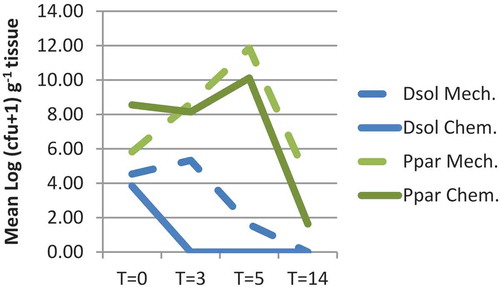
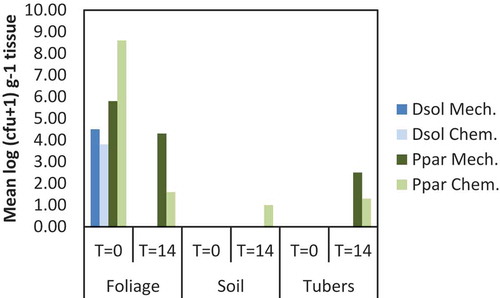
Fig. 6 Population densities of Dickeya solani (Dsol) and Pectobacterium parmentieri (Ppar) in foliage, soil or tubers at 0 and 14 days after chopping the haulms followed by herbicide treatment of stalks (Mech.) or after chemical vine killing (Chem.)