Figures & data
Table 1. Isolates of Fusarium proliferatum originating from cannabis (Cannabis sativa L., marijuana) plants included in this study
Fig. 1 Symptoms of infection caused by Fusaium proliferatum on stock (mother plants). (a) Healthy plants approximately 6 months of age. (b) Advanced infection causing yellowing and necrosis of leaves, and wilting symptoms. (c) Total collapse and defoliation of a severely diseased plant. (d) Symptoms of crown decay in the plant shown in (b) with black streaks. (e) Cross-section through a stem of a stock plant showing early internal black discoloration in the pith tissues. (f) More advanced internal stem discoloration and decay of the pith and xylem tissues. (g) Pith decay resulting from infection by F. proliferatum at a distance of 100 cm from the crown. Stem on the far right is from a healthy plant. (h) More advanced pith decay showing black streaks in the pith and shredding of the tissues. (i) Colonies of F. proliferatum recovered from diseased pith tissues shown in (g)
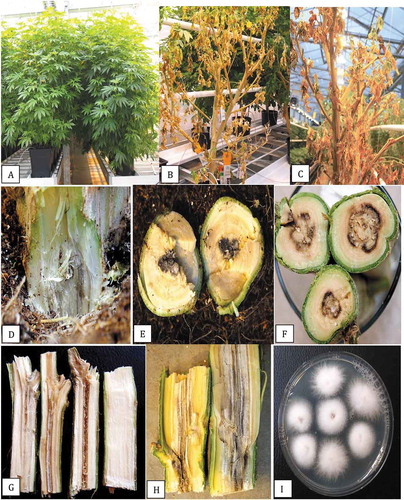
Fig. 2 Recovery of Fusarium proliferatum from diseased stem tissues and growth characteristics on potato dextrose agar. (a) Surface view (left) and bottom view (right) of isolation plates showing 100% recovery of F. proliferatum from diseased pith tissues after 7 days. (b) A one-month-old isolation plate showing fluffy white aerial mycelium. (c, d) Six week-old colonies with white aerial mycelial strands on the colony surface (c) and intense purple pigmentation produced on the underside of the colonies (d). (e) Comparison of the growth of six isolates of F. proliferatum on PDA after 10 days. (f-h) Scanning electron micrographs of mycelium and spore production by F. proliferatum in culture. (f) Microconidia produced in false heads. (g, h) Microconidia produced in long chains
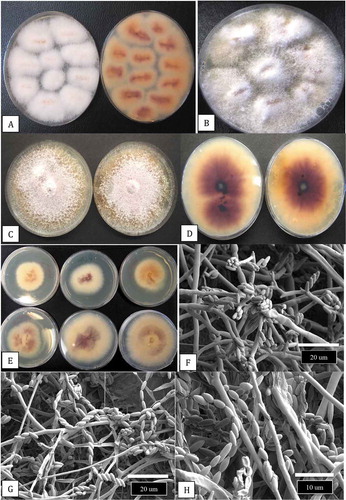
Fig. 3 Development of symptoms caused by Fusarium proliferatum on cannabis plants in the vegetative and flowering stages. (a) Foliar necrosis and collapse of rooted cuttings. (b) Marginal necrosis of leaves. (c, d) Extensive yellowing and necrosis of foliage of flowering plants of strains ‘Hash Plant’ and ‘White Rhino’. (e, f) Internal stem necrosis of the pith and xylem tissues of flowering plants shown in (c) and (d). (g) Recovery of F. proliferatum from cuttings taken 100 cm from the crown of diseased plants and inserted into PDA slants. Mycelial growth was visible after 5 days
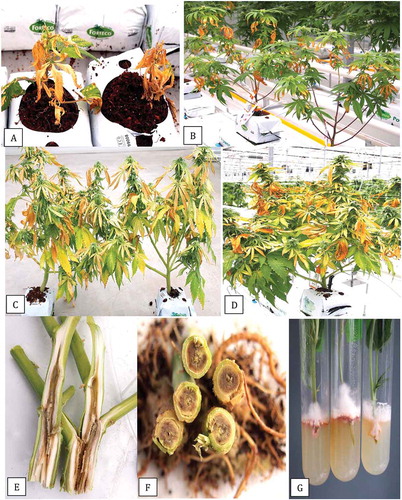
Fig. 4 PCR band of size ca. 700 bp obtained for 20 isolates of Fusarium proliferatum from cannabis plants (BC-5, BC-6, BC-8, BC-9, BC-10, BC-11, BC-12, BC-13, BC-14, BC-15, BC-17, BC-18, BC-21, BC-22, BC-24, BJ-1, NB-2, ON-1, CA-1, CA-2) using the EF-1α primer set. Lane C is the water control. Molecular weight standard is shown (L)
Fig. 5 Phylogenetic analysis of 23 isolates of Fusarium proliferatum originating from cannabis plants (see ) using EF-1α sequences compared to isolates from other hosts (GenBank numbers are shown). Isolates were obtained from a range of tissue sources and from different licenced facilities in BC, ON, and NB, and one site in CA. A bootstrap consensus tree was inferred from 1000 replicates to represent the distance using the neighbour-joining (NJ) method. Branches corresponding to partitions reproduced in less than 50% bootstrap replicates were collapsed. The outgroup was Sclerotinia sclerotiorum.
Fig. 6 (a) Comparison of radial growth of an isolate of Fusarium proliferatum (BC-5) with F. oxysporum (BC-4) at seven temperatures after 6 days. Means from five replicate dishes ± standard error are shown. The experiment was conducted twice. (b) Comparison of growth of F. proliferatum after 6 days at 10–35°C, at 5°C increments. The underside of the colonies are shown to reveal the extent of pigmentation produced
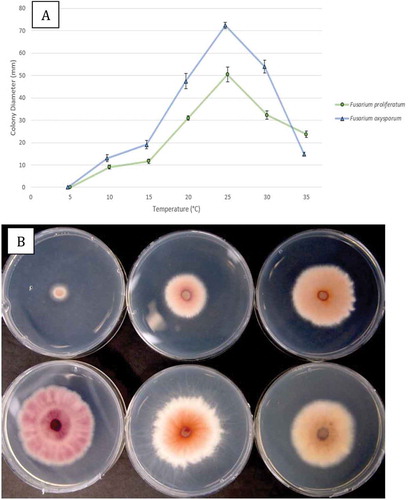
Fig. 7 Pathogenicity testing of Fusarium proliferatum using three different methods. (a) Stem cuttings of ‘Hash Plant’ were inoculated in a test-tube with a mycelial plug. Mycelial growth on the stem is shown after 7 days of incubation. (b) Cuttings removed from the test-tubes to show mycelial colonization of the stem and wilting of the cuttings. (c) Inoculation of cuttings of ‘Hash Plant’ by dipping in a spore suspension for 5 min and inserting into a rockwool block. Stem colonization and wilting can be seen after 7 days. (d, e) Inoculation of rooted cuttings of ‘Hash Plant’ grown in a coco coir: perlite potting mixture with a mycelial+spore suspension. (d) Wilting symptoms after 7 days. (e) Stem colonization and plant death after two weeks. (f) Non-inoculated control plant shows no symptoms after two weeks. (g) Symptoms on ‘Critical Kali Mist’ plants two weeks after inoculation with a mycelial + spore suspension. Extensive wilting and foliar necrosis can be seen on inoculated plant (right). (h) Symptoms on a tomato plant inoculated with F. proliferatum (right) compared to the non-inoculated control plant (left) after two weeks. (i) Symptoms on a cucumber plant inoculated with F. proliferatum (right) compared to the non-inoculated control plant (left) after two weeks. (j) Symptoms of foliar necrosis developing on the lower part of a stock plant inoculated with a mycelial + spore suspension of F. proliferatum after one week. (k) The same plant after two weeks showing stem die-back and wilting. (l) Decay of the crown tissues and mycelial growth inside the stem of the diseased plant shown in (k)
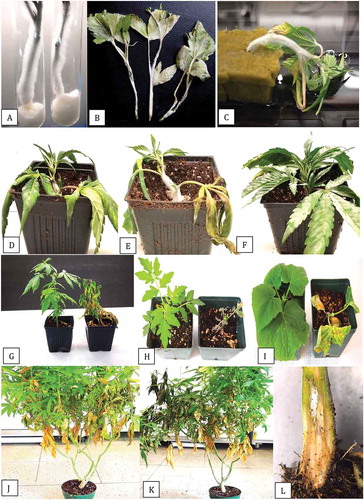
Fig. 8 Pathogenicity testing and response of five cannabis strains to inoculation with Fusarium oxysporum and F. proliferatum in a test-tube assay. The extent of stem colonization was measured after 7 and 10 days. Data shown are for 10 days and are means of four replicates ± standard errors. The experiment was conducted twice. Strains tested in each test-tube were: ‘OG Kush’, ‘Hash Plant’, ‘Copenhagen Kush’, ‘White Rhino’ and ‘Island Honey’. While there were no differences among strains in response to the two Fusarium species, colonization by F. proliferatum was significantly greater on ‘Hash Plant’, ‘Copenhagen Kush’, and ‘Island Honey’ when compared to F. oxysporum.
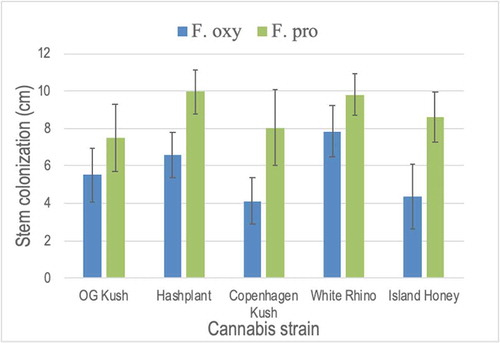
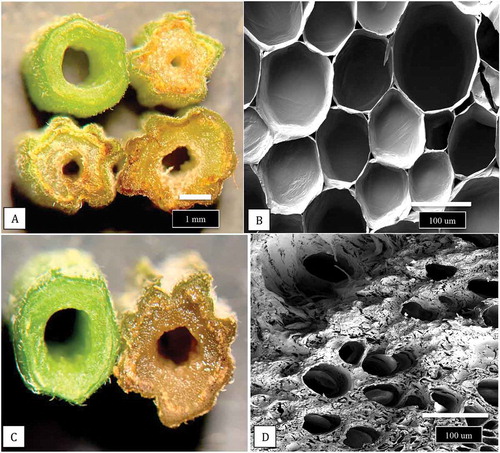
Fig. 9 The extent of development of the central pith tissues in cannabis stem cuttings. The cuttings were obtained from stock plants at the same stage of growth and sequential stem pieces were taken (from top to bottom) and sectioned by hand and 3 mm thick slices were placed on the observation stage of a dissecting microscope and photographed at the same magnification. (a, b) Early stage of pith development with densely packed central parenchyma cells. (c, d) Loosely packed parenchyma cells in the pith region. (e, f) Development of hollow central pith where parenchyma cells are absent. (g, h) Complete development of central pith in stem cutting of cannabis strain ‘Hash Plant’. Scale bars shown in a and b apply to all figures
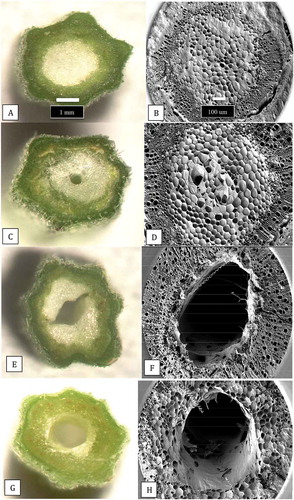
Fig. 10 (a) Scanning electron micrograph of a healthy stem cutting taken from a stock plant showing the hollow pith surrounded by a ring of xylem tissues. A portion of the remaining pith cells (arrow) that has not disintegrated can be seen. (b) Healthy stem sections that were stained with 1% safranin red to show the uptake of the red dye in the ring of xylem cells (arrow). (c) Scanning electron micrograph of a section made through a young cannabis stem cutting to show the organization of the outermost epidermal cell layer with a dense covering of hair-like trichomes, the inner ring of xylem cells, and the innermost central parenchyma pith cells. The cutting was inoculated with a spore suspension of Fusarium proliferatum and the mycelium has progressed into the pith (white arrow). The advancement of the mycelial front is shown by the blue arrows. Photo was taken 5 days after inoculation
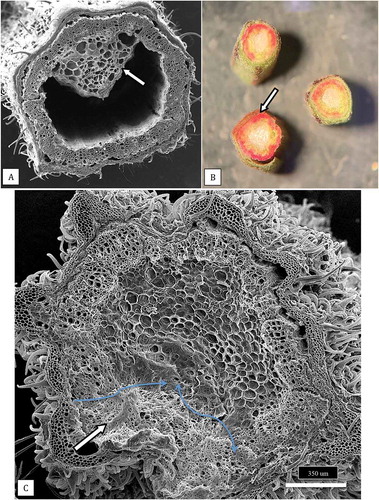
Fig. 11 Comparison of hand sections made through a non-inoculated stem cutting with those infected by F. proliferatum. (a) Healthy cutting (top left) compared with three different stages of necrosis and tissue disruption caused by pathogen invasion of inoculated stem cuttings. (b) Healthy parenchyma cells viewed under the scanning electron microscope. (c) Close-up of a healthy cutting (left) with a diseased cutting (right). (d) Parenchyma cells in a diseased cutting that are disrupted and show accumulation of a dense matrix that could be a combination of cellular contents and polysaccharides