Figures & data
Fig. 1 A pictorial key (scale 0–5) for the assessment of blackleg severity based on % area of blackened stem tissue on the cross section cut through the crown of plant. A score of ‘0’ indicates the absence of disease and ‘5’ shows 100% disease with stem constrictions (dry and dead). The increment between ‘0’ and ‘4’ is 25%. At ‘4’, the blackened tissue may exceed 75%, but there is generally no constriction of the stem and the plant is not completely dead
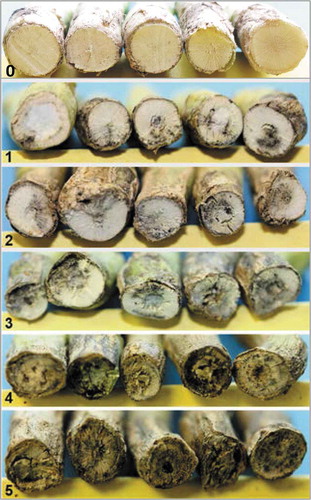
Table 1. Fungicides registered for foliar treatment against blackleg of canola in Canada as of 2011 and used in this study
Table 2. Effect of fungicide treatment and application timing on mean disease incidence (MDI) and disease severity index (DSI) of blackleg on Westar in western Canada (13 station years)
Table 3. The effect of fungicide treatment and application timing on seed yield of the blackleg susceptible cultivar Westar in western Canada (12 station years). δ.
Table 4. Effect of pyraclostrobin treatment at the 2–4 leaf stage on mean disease incidence (MDI) and disease severity index (DSI) of blackleg (13 station years), and yield (12 station years) on the blackleg resistant varieties 43E01 (MR) and 45H29 (R)
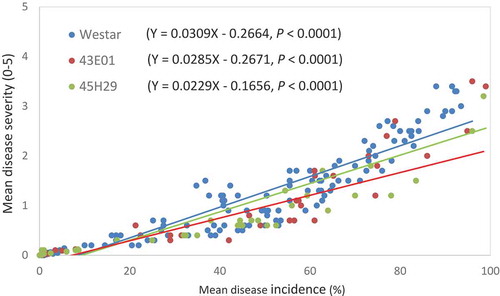
Fig. 2 Regression and correlation of mean disease severity (MDS) to mean disease incidence (MDI) on susceptible (S), moderately resistant (MR) and resistant (R) canola cultivars against blackleg in 17 station-year field trials on the Canadian prairies (2011–2014)