
Figures & data
Fig. 1 Trianthema portulacastrum. (a) Lesions on stems; and (b) leaves caused by G. trianthemae under field conditions; (c) non-inoculated; and (d) symptomatic plants 14 days post-inoculation with isolate Gibbt 1 in the greenhouse
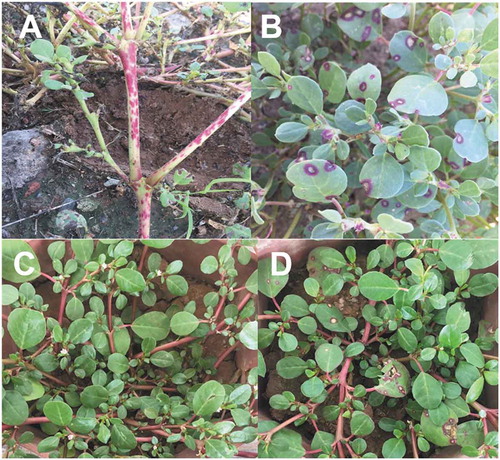
Table 1. Morphological characteristics and measurements of asexual structures of ten isolates of Gibbago trianthemae obtained from Trianthema portulacastrum in Sinaloa, Mexico
Fig. 2 Gibbago trianthemae. (a) Conidiophores and conidia on infected tissue; (b) Colony on PDA; (c) Conidiophore with apical swelling bearing conidium and detached conidia; (d) Geniculated conidiophore. Scale bar = 20 µm
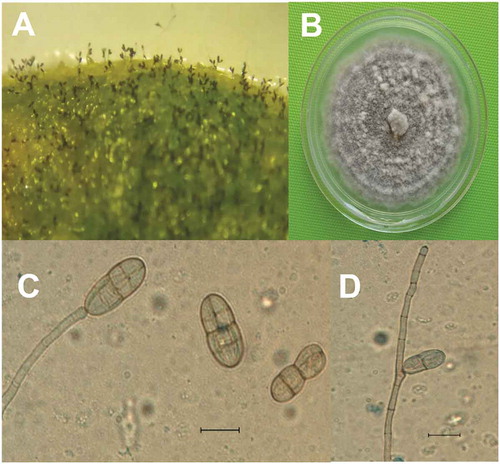
Fig. 3 Neighbour joining tree based on the partial internal transcribed spacer region of Gibbago trianthemae specimens. The tree was constructed with MEGA X (bootstrap = 1000), using the Kimura 2-parameter model and a gamma distribution (+G) to model the among-site rate variation. The corresponding sequence of Neocamarosporium sp. was used as an outgroup. Database accession numbers of the sequences are provided in parentheses. Bootstrap values are given as percentages. Nine isolate sequences obtained in this work were included in the tree and are shown in bold. The scale bar indicates the number of nucleotide substitutions per site
Table 2. Pathogenicity of Gibbago trianthemae in horse purslane plants