Figures & data
Fig. 1 (Colour online) Functional domains, phylogenetic tree and expression of ChSch9. (a) Domain structures of ChSch9 as annotated by SMART. (b) Neighbour-joining tree of ChSch9 in Colletotrichum higginsianum and other selected fungi, including some model and pathogenic fungi. All the sequences were downloaded from NCBI and their accession numbers are shown following the gene names. The numbers at branch nodes are bootstrap percentages out of 1000 replicates. (c) Expression profiles of ChSch9 relative to actin gene (CH063_05065) from C. higginsianum was used for normalization of expression in Mycelium from PDB culture and at different infection stages on Arabidopsis (24, 48, 72 and 90 hpi) by qRT-PCR. Relative abundance of ChSch9 transcripts during infectious growth was normalized by comparing with vegetative growth in PDB (relative expression level = 1, hyphae used as reference sample and normalized with actin gene). Three independent biological experiments with three replicates in each treatment were performed. Error bars represent the standard deviation
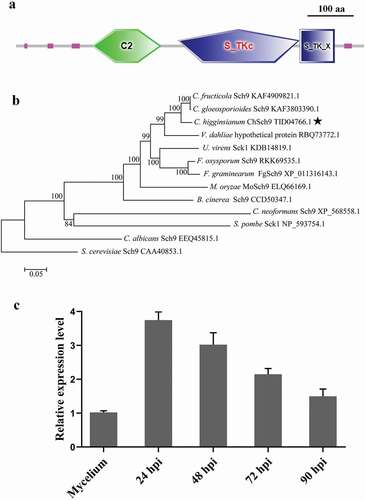
Fig. 2 (Colour online) Deletion and complementation of ChSch9. (a) Strategic map of gene deletion vector construction and sites for restriction enzymes. (b) Amplification of ChSch9 with four pairs of primers in deletion mutants. Line 1 shows the presence of ChSh9 gene in the wild-type, whereas lines 2–3, 4–5 ,6–7, 8–9 represent the HYG, upstream flanking region/Hph overlapping sequence, and downstream flanking region/Hph overlapping sequence in ΔChSch9-16 and ΔChSch9-22, respectively. (c) Confirmation of deletion and complemented strains with RT-PCR
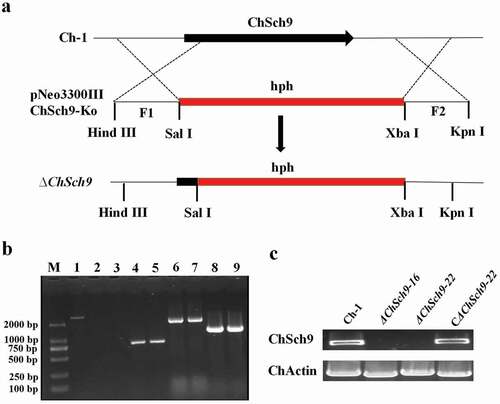
Fig. 3 (Colour online) ChSch9 is critical for vegetative growth and conidiation in Colletotrichum higginsianum. (a) Morphology of colonies of mutant strains. Ch-1 and mutants were grown on PDA plates for 7 d. (b) Statistical analysis of growth rate of Ch-1 and mutants. Diameter of each strain was measured after culturing at 25°C for 7 d. (c) Hyphal tips of strains. Ch-1 and mutants were grown on cellophane overlying PDA for 4 d and hyphal tips were observed by microscopy. Scale bar, 50 μm. (d) Statistical analysis of mycelial dry weight. (e) Statistical analysis of conidial production. (f) Relative expression of different conidiation-related genes in the wild-type and deletion mutants of ChSch9 (relative expression level = 1, wild-type used as reference sample and normalized with actin gene). Error bars represent standard deviation. Three independent biological experiments with three replicates in each treatment were performed. Different letters represent significant differences between the mutant and wild-type at P < 0.05
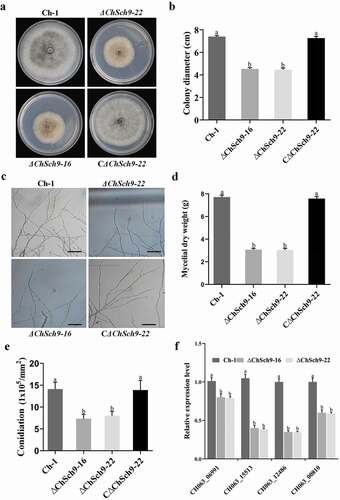
Fig. 4 (Colour online) ChSch9 is essential for various stress tolerances. (a) Colony morphology of Ch-1 and ChSch9 deletion mutants in the presence of different stresses. Strains were cultured on PDA alone or PDA medium with 300 μg mL−1 CR, 300 μg mL−1 CFW, 0.005% SDS, 0.7 M NaCl, 1.2 M KCl, 1 M Sorbitol and 10 mM H2O2. Cultures were photographed after 7 d at 25°C. (b) Inhibition rate was calculated based on colony diameter of strains subjected to different stresses after 7 d. For each strain, the inhibition ratio in growth by different stresses was estimated in comparison with its growth on regular PDA. (c) Expression of seven chitin synthase genes in the wild-type and ChSch9 deletion mutants. (d) Expression levels of catalase and peroxidase in the wild-type and deletion mutants (relative expression level = 1, wild-type used as reference sample and normalized with actin gene). Error bars represent standard deviation. Three independent biological experiments with three replicates in each treatment were performed. Different letters represent significant differences between treatments at P < 0.05
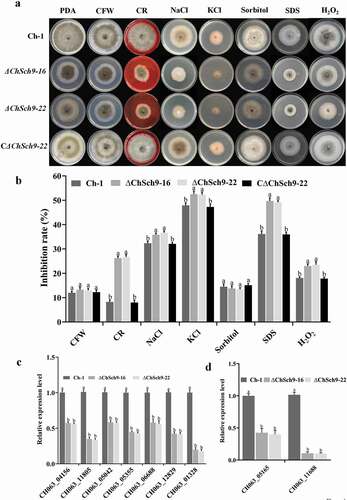
Fig. 5 (Colour online) ChSch9 is involved in the negative regulation of heat tolerance. (a) Ch-1, ChSch9 deletion mutants and complemented strains were cultured on PDA at 25°C and 35°C. Images were taken after 5 d of incubation at 25°C and 35°C. (b) Inhibition rate of the radiated growth of each strain on the PDA at 35°C compared with that of growth at 25°C. (c) Relative expression of Chgsy2 and Chhsp70 in the hyphae of mutants incubated at 35°C for 3 h (relative expression level = 1, wild-type used as reference sample and normalized with actin gene). Error bars represent the standard deviation. Three independent biological experiments with three replicates in each treatment were performed. Different letters represent significant differences between treatments at P < 0.05
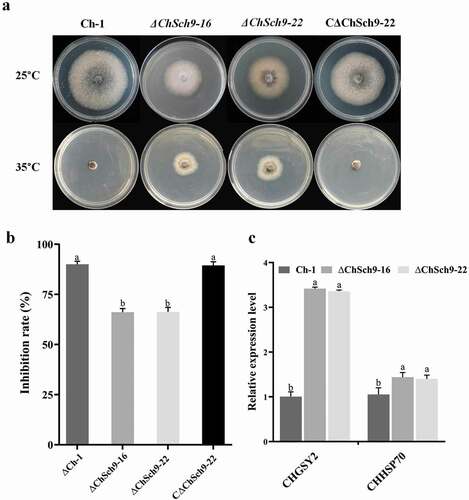
Fig. 6 (Colour online) Carbon source utilization of the ChSch9 deletion mutants. (a) Colony morphology of the wild-type, ChSch9 deletion mutants and complemented strain grown on Czapek medium supplemented with 80 mM glucose, 40 mM potassium acetate, 40 mM ethanol and 5 mM acetaldehyde for 7 d at 25°C. (b) Mycelial growth rates were determined 7 d after incubation at 25°C under different supplied carbon sources. Error bars represent the standard deviation. Three independent biological experiments with three replicates in each treatment were performed. Different letters represent significant differences within the same carbon source (P < 0.05)
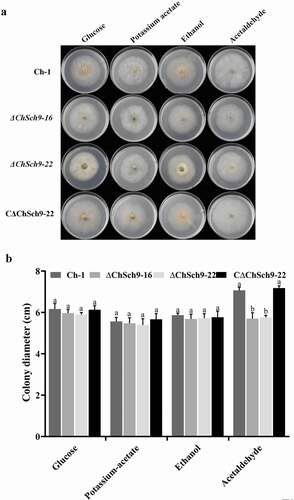
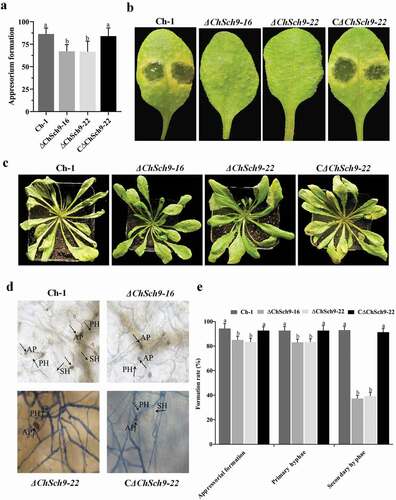
Fig. 7 (Colour online) ChSch9 is essential for plant infection by Colletotrichum higginsianum. (a) Appressorial formation of Ch-1 and mutants on hydrophobic surface. Total 10 µL of conidial suspension of each strain was dropped on to the hydrophobic surface and these were incubated at 25°C for 24 h. (b) Pathogenicity assays with attached Arabidopsis leaves. Ten microlitres of conidial suspensions of each strain were spotted on to the Arabidopsis leaves and incubated at 25°C for 4 d. (c) Pathogenicity assays with Arabidopsis plants. Conidial suspensions of each strain were sprayed on to the Arabidopsis plants and incubated at 25°C for 4 d, 3 mL of conidial suspension was sprayed on each plant. (d) At 4 dpi, inoculated leaves were fixed, stained with Trypan blue and photographed under a microscope. AP, appressoria; PH, primary hyphae; SH, secondary hyphae. (e) Percentage penetration rates of the strains on Arabidopsis leaves. Approximately 300 conidia or appressoria were observed per incubated site. Error bars represent the standard deviation. All treatments had three independent biological repeats. Different letters represent significant differences between treatments at P < 0.05