Figures & data
2021 CPDS SECTION EDITORS AND ADDRESSES
Table 1. Diseases/symptoms detected in Christmas tree samples submitted to the BCMAFF Plant Health Laboratory in 2020
Table 2. Diseases/symptoms detected in field crop samples submitted to the BCMAFF Plant Health Laboratory in 2020
Table 3. Diseases/symptoms detected in greenhouse floriculture samples submitted to the BCMAFF Plant Health Laboratory in 2020
Table 4. Diseases/symptoms detected in forest nursery samples submitted to the BCMAFF Plant Health Laboratory in 2020
Table 5. Diseases/symptoms detected in greenhouse vegetable samples submitted to the BCMAFF Plant Health Laboratory in 2020
Table 6. Diseases/symptoms detected in herbaceous perennial samples submitted to the BCMAFF Plant Health Laboratory in 2020
Table 7. Diseases/symptoms detected in nut samples submitted to the BCMAFF Plant Health Laboratory in 2020
Table 8. Diseases/symptoms detected in small fruit (berry) samples submitted to the BCMAFF Plant Health Laboratory in 2020
Table 9. Diseases/symptoms detected in specialty crop samples submitted to the BCMAFF Plant Health Laboratory in 2020
Table 10. Diseases/symptoms detected in tree fruit and grape samples submitted to the BCMAFF Plant Health Laboratory in 2020
Table 11. Diseases/symptoms detected in golf course, sod and lawn samples submitted to the BCMAFF Plant Health Laboratory in 2020
Table 12. Diseases/symptoms detected in field vegetable samples submitted to the BCMAFF Plant Health Laboratory in 2020
Table 13. Diseases/symptoms detected in woody ornamental samples submitted to the BCMAFF Plant Health Laboratory in 2020
Table 1. Diseases diagnosed on ornamental nursery crops submitted to Elmhirst Diagnostics & Research in 2020
Table 2. Diseases diagnosed on field vegetable and potato samples submitted to Elmhirst Diagnostics & Research in 2020
Table 3. Diseases diagnosed on berry samples submitted to Elmhirst Diagnostics & Research in 2020
Table 1. Diseases diagnosed on cereal crop samples submitted to the Alberta Plant Health Lab in 2020
Table 2. Diseases diagnosed on canola samples submitted to the Alberta Plant Health Lab in 2020
Table 3. Diseases diagnosed on potato samples submitted to the Alberta Plant Health Lab in 2020
Table 4. Diseases diagnosed on legume samples submitted to the Alberta Plant Health Lab in 2020
Table 5. Diseases diagnosed on trees and fruits submitted to the Alberta Plant Health Lab in 2020
Table 6. Diseases diagnosed on vegetable crops submitted to the Alberta Plant Health Lab in 2020
Table 7. Diseases diagnosed on other crops submitted to the Alberta Plant Health Lab in 2020
Table 1. Diseases diagnosed on vegetable samples (including greenhouse vegetables) submitted to the University of Guelph Plant Disease Clinic in 2020
Table 2. Diseases diagnosed on fruit samples submitted to the University of Guelph Plant Disease Clinic in 2020
Table 3. Diseases diagnosed on herbaceous ornamental samples submitted to the University of Guelph Plant Disease Clinic in 2020
Table 4. Plant diseases diagnosed on woody ornamental samples submitted to the University of Guelph Plant Disease Clinic in 2020
Table 5. Diseases diagnosed on field crop samples submitted to the University of Guelph Plant Disease Clinic in 2020
Table 6. Diseases diagnosed on herb and specialty crop samples submitted to the University of Guelph Plant Disease Clinic in 2020
Table 1. Disease/symptoms detected in samples submitted to the MCRS diagnostic laboratory in 2020
Tableau 1. Sommaire des maladies diagnostiquées parmi les plantes maraîchères reçues au Laboratoire d’expertise et de diagnostic en phytoprotection du MAPAQ en 2020
Tableau 2. Sommaire des maladies diagnostiquées parmi les arbres fruitiers et petits fruits reçus au Laboratoire d’expertise et de diagnostic en phytoprotection du MAPAQ en 2020
Tableau 3. Sommaire des maladies diagnostiquées parmi les grandes cultures/céréales et cultures industrielles reçues au Laboratoire d’expertise et de diagnostic en phytoprotection du MAPAQ en 2020
Tableau 4. Sommaire des maladies diagnostiquées parmi les plantes fourragères reçues au Laboratoire d’expertise et de diagnostic en phytoprotection du MAPAQ en 2020
Tableau 5. Sommaire des maladies diagnostiquées parmi les arbres et arbustes ornementaux reçus au Laboratoire d’expertise et de diagnostic en phytoprotection du MAPAQ en 2020
Tableau 6. Sommaire des maladies diagnostiquées parmi les plantes herbacées ornementales reçues au Laboratoire d’expertise et de diagnostic en phytoprotection du MAPAQ en 2020
Tableau 7. Sommaire des maladies diagnostiquées parmi les plantes aromatiques et médicinales reçues au Laboratoire d’expertise et de diagnostic en phytoprotection du MAPAQ en 2020
Table 1. Diseases diagnosed on fruit tree crop samples submitted to the NBDAAF Plant Disease Diagnostic Laboratory in 2020
Table 2. Diseases diagnosed on berry crop samples submitted to the NBDAAF Plant Disease Diagnostic Laboratory in 2020
Table 3. Diseases diagnosed on vegetable (field and greenhouse) crop samples submitted to the NBDAAF Plant Disease Diagnostic Laboratory in 2020
Table 4. Diseases diagnosed on cereal crop samples submitted to the NBDAAF Plant Disease Diagnostic Laboratory in 2020
Table 5. Diseases diagnosed on trees, shrubs and ornamental plant samples submitted to the NBDAAF Plant Disease Diagnostic Laboratory in 2020
Table 1. Summary of diseases diagnosed on commercial crop samples submitted to the PEI Analytical Laboratories, Plant Disease Diagnostic Service in 2019
Table 1. Diseases diagnosed on commercial crop samples submitted to the PEI Analytical Laboratories, Plant Disease Diagnostic Service in 2020
Table 1. Prevalence and incidence of leaf spot pathogens in oat and barley in Saskatchewan in 2020
Table 2. Prevalence and frequency of Fusarium species isolated from infected oat kernels in Saskatchewan in 2020
Table 1. Disease incidence and severity in 30 commercial barley fields in central Alberta, 2020
Table 1. Field incidence, severity and range of barley leaf diseases in the South Peace region of Alberta, 2020
Table 1. Prevalence and severity of barley diseases in Ottawa, Ontario in 2020
Table 2. Prevalence of Fusarium species isolated from putatively infected barley kernels in Ottawa, Ontario in 2020
Fig. 1 Foliar disease progress curves for barley yellow dwarf (BYDV), net blotch (Pyrenophora teres) and spot blotch (Cochliobolus sativus) in barley fields in Ottawa, Ontario in 2020. Each point is the mean of three fields and three sites per field. Severities of these diseases were visually estimated on a scale of 0 to 9, six times during the growing season when plants were at the tillering, booting, heading, flowering, milk, and soft dough stages of growth, respectively
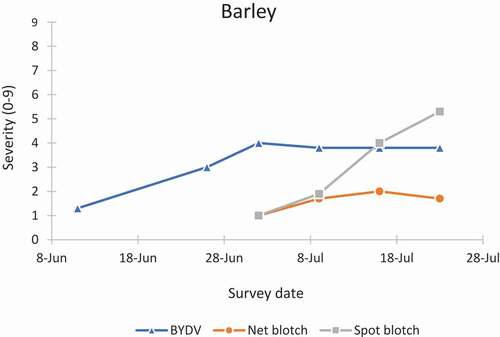
Table 1. Frequencies (%) of virulence of Puccinia coronata f. sp. avenae isolates from the eastern prairie region and eastern Canada on 16 standard and eight supplemental crown rust differential oat lines in 2019
Table 1. Prevalence and severity of oat diseases in Ontario in 2020
Table 2. Prevalence of Fusarium species isolated from putatively infected oat kernels in Ontario in 2020
Fig. 1 Foliar disease progress curves for barley yellow dwarf (BYDV), Stagonospora leaf blotch (Stagonospora avenae f. sp. avenaria), halo blight (Pseudomonas syringae pv. coronafaciens), crown rust (Puccinia coronata f. sp. avenae), pyrenophora leaf blotch (Pyrenophora avenae), spot blotch (Cochliobolus sativus) and stem rust (Puccinia graminis f. sp. tritici) in oat fields in Ottawa, Ontario in 2020. Each point is the mean of three fields and three sites per field. The severity of these diseases was visually estimated on a scale of 0 to 9, six times during the growing season when plants were at the tillering, booting, heading, flowering, milk, and soft dough stages of growth, respectively
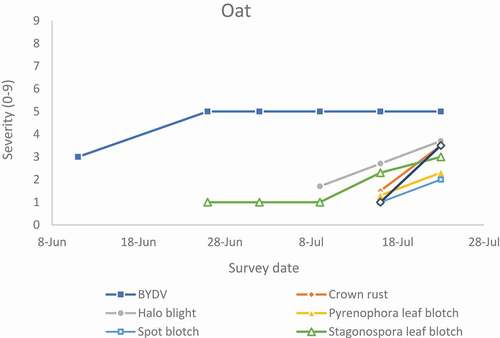
Table 1. Isolation frequency of leaf spot pathogens of barley in Manitoba, 2020
Table 2. Incidence and isolation frequency of leaf spot pathogens oat in Manitoba, 2020
Table 1. Prevalence and severity of Fusarium head blight (FHB) in barley crops in Manitoba in 2020
Table 2. Fusarium spp. identified from barley kernels of 42 fields in Manitoba, 2020
Table 3. Fusarium spp. identified from the oat kernels of 19 fields in Manitoba, 2020
Table 1. Fusarium head blight incidence and severity (FHB index) in spring wheat fields in Manitoba in 2020
Table 2. Fusarium species isolated from kernels in FHB-affected spring wheat fields in Manitoba in 2020
Table 1. Leaf spot severity in spring wheat fields in Manitoba in 2020
Table 2. Prevalence and isolation frequency of leaf spot pathogens in spring wheat fields in Manitoba in 2020
Table 3. Prevalence and isolation frequency of leaf spot pathogens in winter wheat fields in Manitoba in 2020
Table 1. Incidence and severity of leaf spotting diseases and percentage isolation of the most common leaf spotting pathogens in common and durum wheat crops surveyed in Saskatchewan in 2020
Fig. 1 Soil zone map with common and durum wheat fields surveyed across Saskatchewan in 2020
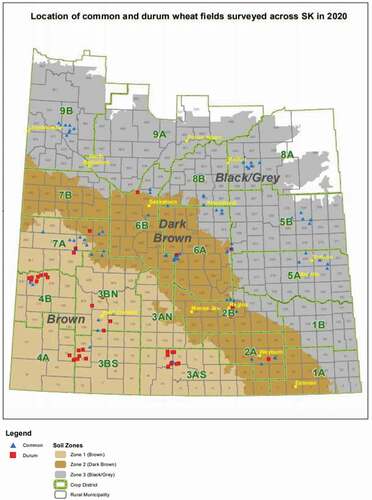
Fig. 2 Three-month (May 3-July 31) percentage of average precipitation for 2020 on the Canadian prairies. Normal precipitation is based on 1981–2010 (Agriculture and Agri-Food Canada Citation2020)
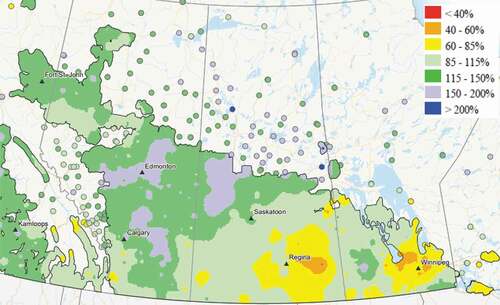
Table 1. Prevalence and severity of spring wheat diseases in Ontario in 2020
Table 2. Prevalence of Fusarium species isolated from putatively infected wheat kernels in Ontario in 2020
Fig. 1 Foliar disease progress curves for bacterial blight (Pseudomonas syringae pv. syringae), septoria/stagonospora leaf blotch (Zymoseptoria tritici and Parastagonospora spp.), spot blotch (Cochliobolus sativus) and tan spot (Pyrenophora tritici-repentis) in spring wheat fields in Ottawa, Ontario in 2020. Each point is the mean of three fields and three sites per field. Severities of these diseases were visually estimated on a scale of 0 to 9, six times during the growing season when plants were at the tillering, booting, heading, flowering, milk, and soft dough stages of growth, respectively
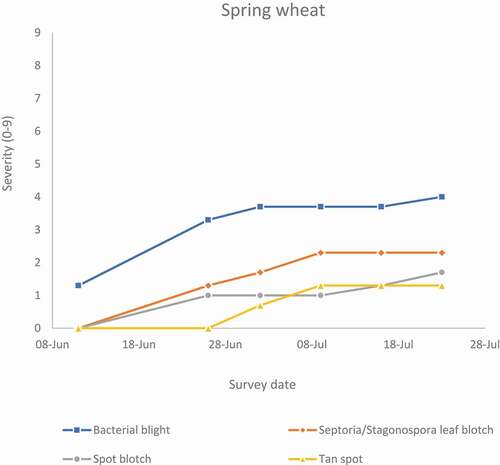
Table 1. Prevalence and severity of winter wheat diseases in Ontario in 2020
Fig. 1 Foliar disease progress curves for bacterial blight (Pseudomonas syringae pv. syringae), septoria/stagonospora leaf blotch (Septoria tritici and Stagonospora spp.), powdery mildew (Blumeria graminis f.sp. tritici), spot blotch (Cochliobolus sativus) and tan spot (Pyrenophora tritici-repentis) in winter wheat fields in Ottawa, Ontario in 2020. Each point is the mean of three fields and three sites per field. Severities of these diseases were visually estimated on a scale of 0 to 9, four times during the growing season when plants were at the heading, flowering, milk, and soft dough stages of growth, respectively
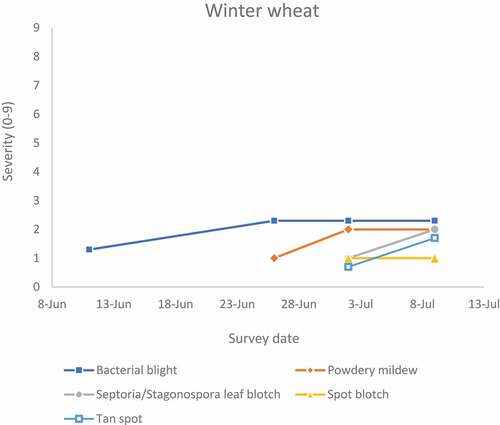
Table 1. Incidence of visual FHB and number of Fusarium spp. isolated from wheat spikes in PEI in 2020
Fig. 1 Google maps screen capture with sample locations indicated and provincial counties labeled
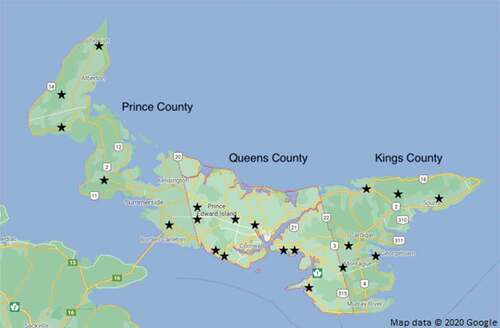
Table 1. Disease severity and incidence for 15 barley fields surveyed during the 2020 growing season in central Alberta
Table 2. Disease severity and incidence for 21 spring wheat fields surveyed during the 2020 growing season in central Alberta
Table 1. Incidence and severity of cereal diseases in 53 fields in northern Alberta in August, 2020
Table 1. Number of wheat and barley fields surveyed and the corresponding stripe rust severity levels recorded in southern and central Alberta during the summer of 2020, 2019, 2018, 2017 and 2016
Table 2. Severity of natural stripe rust infection (percentage of leaf area covered with pustules) on a set of 18 differential wheat lines in the susceptible Avocet background grown at four sites in Alberta: Brooks, Lethbridge, Beaverlodge and Edmonton
Fig. 1 Locations of cereal fields surveyed for incidence and severity of stripe rust in southern Alberta, July 2020. Severity as percentage of leaf covered with stripes: green = 0%; yellow = <5%; orange = 5 to 15%; red = >15%. Incidence as estimated percentage of total field infected: small circle = <5%; circle with square = 5 to 15%; circle with diamond = >15%
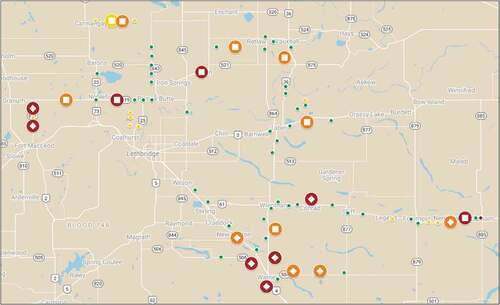
Table 1. Five-year summary of frequency (% PFS) and severity (mean % infection) of Fusarium graminearum and total Fusarium spp. of wheat, durum, barley and oat combined
Table 2. Number of wheat samples tested from September 2019 to May 2020 and levels of infection with Fusarium graminearum and Fusarium spp. in each Saskatchewan Crop District
Table 3. Number of durum samples tested from September 2019 to May 2020 and levels of infection with Fusarium graminearum and total Fusarium spp. in each Saskatchewan Crop District
Table 4. Number of barley samples tested from September 2019 to May 2020 and levels of infection with Fusarium graminearum and total Fusarium spp. in each Saskatchewan Crop District
Table 5. Number of oat samples tested from September 2019 to May 2020 and levels of infection with Fusarium graminearum and total Fusarium spp. in each Saskatchewan Crop District
Table 1. Stripe rust incidence and severity on wheat in southern Alberta in 2020
Table 2. Tan spot incidence and severity on wheat in southern Alberta in 2020
Table 3. Application of fungicides and disease pressure found on surveyed wheat fields
Table 1. A rating scale to estimate blackleg severity on canola (WCC/RCC 2009)
Table 2. Blackleg prevalence, incidence and severity in canola fields in Alberta in 2020
Table 3. Prevalence and incidence of sclerotinia stem rot on canola lower main stems in Alberta, 2020
Fig. 1 Location and severity of blackleg symptoms in 350 canola fields and five mustard fields in 2020
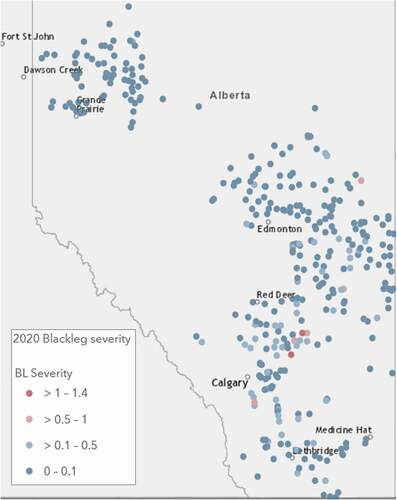
Table 1. Distribution of Plasmodiophora brassicae-infected canola crops identified in Alberta in 2020
Fig. 1 Cumulative cases of clubroot diagnosed in canola crops in Alberta. Since the start of clubroot surveillance in 2003, the disease has been confirmed in 44 counties and municipal districts in the province, as well as in rural areas of the cities of Edmonton and Medicine Hat, and the Town of Stettler
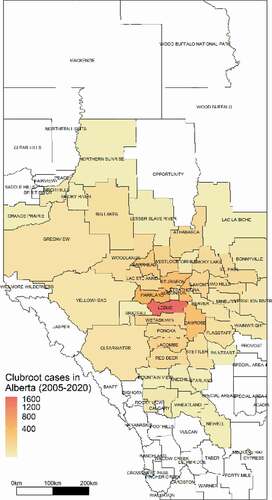
Table 1. Incidence of pathogens recovered from canola roots collected in central and northern Alberta, 2020
Fig. 1 Canola crop affected by severe root disease in lower lying areas of a field in Lacombe County, Alberta, in 2020
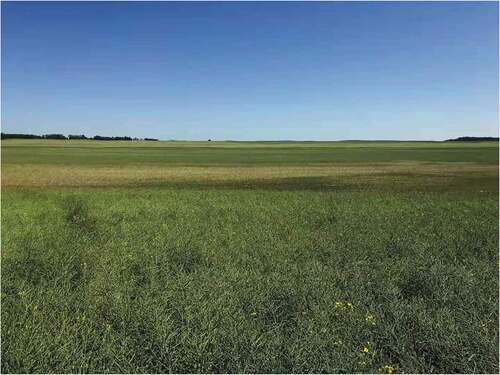
Fig. 2 Diseased canola plants; note lodging, yellowing and senescence in the crop
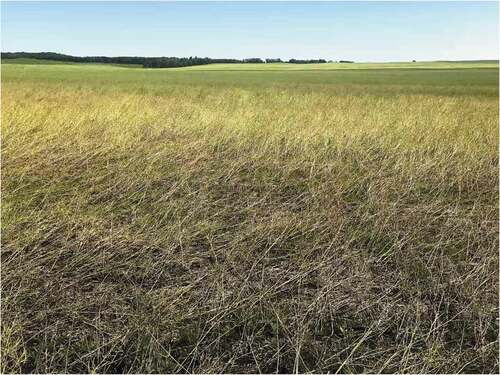
Table 1. Plant area affected (PAA) foliar blight intensity rating scale for lentil
Table 2. Canopy area affected (CAA) rating scale for Botrytis spp. and Sclerotinia sclerotiorum.
Table 3. Prevalence, incidence and severity of lentil diseases in southern Alberta, 2020
Table 1. Prevalence, incidence and severity of pea diseases in southern Alberta, 2020
Table 2. Disease incidence and severity by individual Alberta municipal district (M.D.)/county
Fig. 1 Survey locations for Alberta’s 2020 pea disease survey
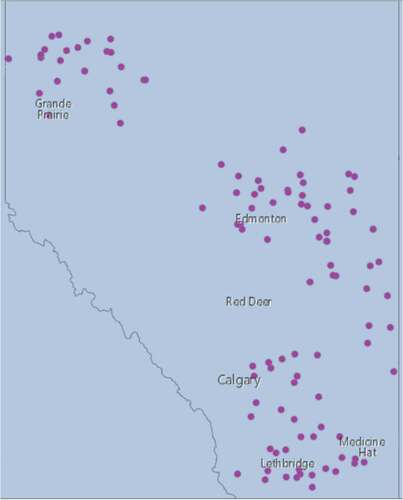
Fig. 2. Main issues observed in Alberta pea fields in 2020: A, drowned low spot in pea field; B, mycosphaerella blight on pea leaves; C, ascochyta blight on pea leaves; D, rot of pea roots
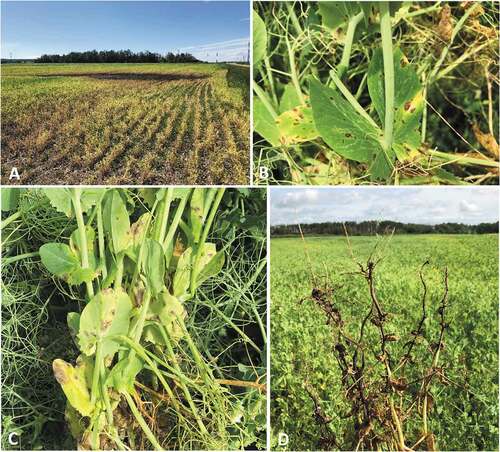
Table 1. Prevalence, incidence and severity of three soybean diseases and nodulation in southern Alberta in 2020
Fig. 1 Eight soybean disease survey locations in Alberta, 2020
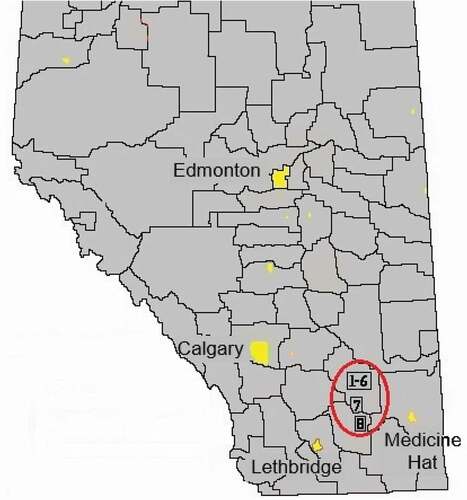
Table 1. Prevalence of phytophthora rot (PRR) and prevalence and severity of root rot in 63 (68 for PRR), 16 and 8 crops of soybean in Manitoba, Saskatchewan and Alberta, respectively, in 2020
Table 1. Sclerotinia rating scale (Kutcher and Wolf 2006)
Table 2. Blackleg rating scale (WCC/RRC 2009)
Table 3. Mean disease incidence and severity of sclerotinia stem rot of canola in Saskatchewan in 2020
Table 4. Mean disease incidence and severity of blackleg basal cankers in Saskatchewan in 2020
Table 5. Prevalence of alternaria pod spot, aster yellows, and foot rot of canola fields surveyed in Saskatchewan in 2020
Table 6. Mean disease incidence and sclerotinia severity reported as the average severity among infected plants and the average severity among all plants surveyed per field, 2011-2020 (Peru et al. 2020)
Table 7. Mean blackleg canker severity reported as the average severity among infected plants and the average severity among all plants surveyed per field, 2011–2019 (Peru et al. 2020)
Table 1. Prevalence of plant diseases in lentil crops surveyed in West-central Saskatchewan, 2012-2020
Table 2. Prevalence of plant diseases in lentil crops surveyed in Southwest Saskatchewan, 2012-2020
Table 3. Prevalence of plant diseases in lentil crops surveyed in Southeast Saskatchewan, 2012-2020
Table 4. Prevalence of plant diseases in lentil crops surveyed in East-central Saskatchewan, 2012-2020
Table 5. Prevalence of plant diseases in lentil crops surveyed Northeast Saskatchewan, 2012-2020
Table 6. Prevalence of plant diseases in lentil crops surveyed Northwest Saskatchewan, 2012-2020
Table 7. Prevalence of plant diseases in lentil crops surveyed in Saskatchewan, 2012-2020
Table 8. Average disease incidence in Saskatchewan lentil crops surveyed in 2020
Table 1. Prevalence of root rot complex, mycosphaerella blight, ascochyta foot rot, white mould and bacterial blight in Saskatchewan field pea crops in 2020
Table 2. Incidence and severity of field pea diseases in Saskatchewan in 2020
Table 3. Severity scale for root rot complex of field pea (Chatterton et al. 2019)
Table 4. Severity rating scale for mycosphaerella blight of field pea (modified from Liu et al. 2013)
Table 5. Ascochyta foot rot stem rating guide (modified from Wang 1998)
Table 1. Summary of pathogens detected in pulse seed samples tested from 2015 to 2019 in Saskatchewan
Table 2. Number of field pea samples tested from September 2019 to May 2020 and levels of infection with Ascochyta spp., Botrytis spp. and Sclerotinia sclerotiorum for each Saskatchewan Crop District
Table 3. Number of lentil seed samples tested from September, 2019 to May, 2020 and levels of infection with Ascochyta lentis, Colletotrichum lentis, Botrytis spp., and Sclerotinia sclerotiorum for each Saskatchewan Crop District
Table 4. Number of chickpea seed samples tested from September 2019 to May 2020 and levels of infection with Ascochyta rabiei, Botrytis spp., and Sclerotinia sclerotiorum for each Saskatchewan Crop District
Table 1. Prevalence, incidence and severity of bacterial blight, brown spot and downy mildew in Saskatchewan soybean fields in 2020
Table 1. Prevalence and severity of root diseases and halo blight in 40 crops of dry bean in Manitoba in late July in 2020
Table 2. Prevalence and severity of foliar diseases in 39 crops of dry bean in Manitoba in August in 2020
Table 1. Mean prevalence, incidence and severity of sclerotinia stem rot and blackleg in Manitoba in 2020
Table 2. Mean prevalence and incidence or severity of alternaria pod spot, aster yellows, fusarium wilt and foot rot in Manitoba in 2020
Table 3. Distribution of incidence (sclerotinia, blackleg, aster yellows, fusarium wilt and foot rot) and severity (alternaria pod spot) classes in 161 crops of Brassica napus in Manitoba in 2020
Table 1. Pasmo incidence and severity in 75 flax crops in Saskatchewan, 11 crops in Manitoba and 86 crops combined in 2020
Table 1. Prevalence and severity of root diseases in 46 crops of field pea in Manitoba in 2020
Table 2. Prevalence and severity of foliar diseases in 14 crops of field pea in Manitoba in 2020.
Table 1. Prevalence of nine pathogens and four other microbes isolated or detected on onion/garlic from 12 locations in Alberta in 2019
Table 2. Prevalence of 14 pathogens and 11 other microbes isolated or detected on onion/garlic from nine locations in Alberta in 2020
Table 3. Percentage of positive samples and maximum and mean population densities (nematodes/100 cm3 soil), for six genera of plant-parasitic nematodes found in the survey of onion and garlic fields. Data from 2019 and 2020 are pooled
Table 1. Nematode counts (nematodes per kilogram of soil) for four genera from three field locations. The October sample shows results from a single composite sample of 40 soil cores. The May and September samples represent the mean of three composite samples of ≥20 soil cores each
Fig. 1 Approximate locations of Alberta potato nematode field survey in 2018 and 2019
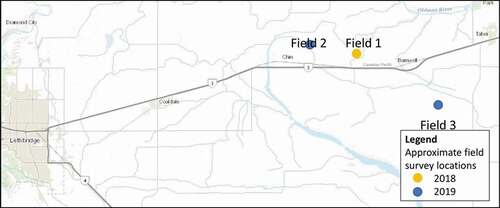
Table 1. Number of Verticillium propagules (germinating microsclerotia) in soil test, % disease incidence and Verticillium Severity Index in Manitoba potato fields in 2020
Table 2. Mean incidence and severity of verticillium wilt disease in fields with a high or low V. dahliae propagule count (CFU/g) in soil
Fig. 1 Visual grading scale (0-5) of Verticillium wilt severity in potato stems (Alkher et al. Citation2009)
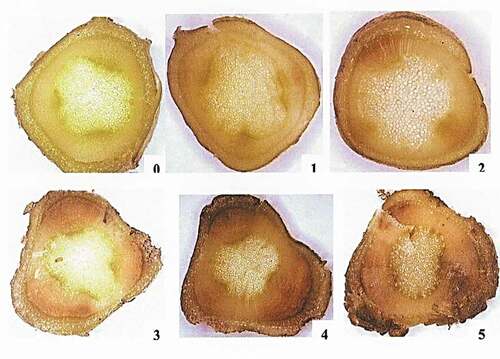
Table 1. Phytophthora and Pythium species found in four western white pine seed orchards in British Columbia
Fig. 1 Western white pine mortality in BC seed orchards. A, early disease stage; B, bent needle symptom; C, roots and necrotic root tips on a dead tree; D, Agdia ImmunoStrip® test positive for Phytophthora spp. (2 red bands) on a soil sample collected at the Saanich Seed Orchard
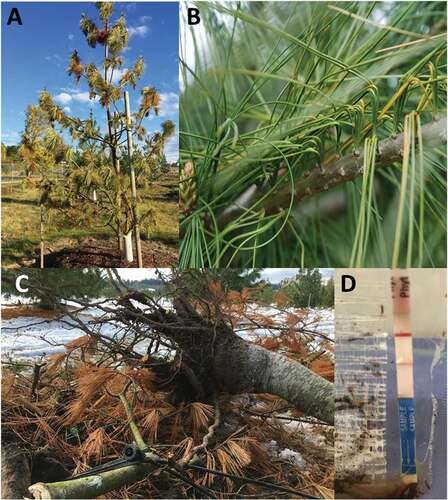
Fig. 2 Phytophthora cactorum isolates obtained from western white pine at the Saanich Seed Orchard and Kalamalka Research Station have different origins. The tree is a maximum-likelihood phylogenetic tree including P. cactorum isolates from the Saanich Seed Orchard and Kalamalka Research Station orchard (in red) and reference sequences for closest homologs retrieved in the NCBI database (in black, with Genbank accession number). Numbers above nodes are statistical support values obtained from 100 bootstrap samples; poor statistical support under 50% is not represented. Grey boxes indicate the alignment position of intraspecific polymorphisms in P. cactorum.
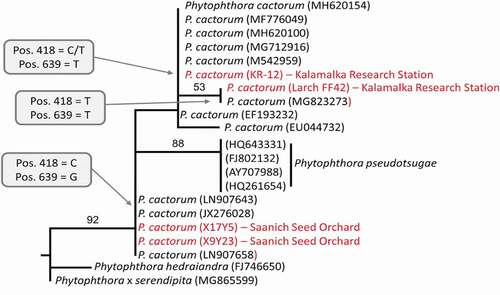
Table 1. Dothistroma samples by species in pine clones and ramets at Smoky Lake, Alberta by observation year
Fig. 1 Northern range of P. flexilis (orange) and sample location (blue star) at the genetic archive in the Alberta Tree Improvement and Seed Centre, Smoky Lake. Google Earth imagery, 2021
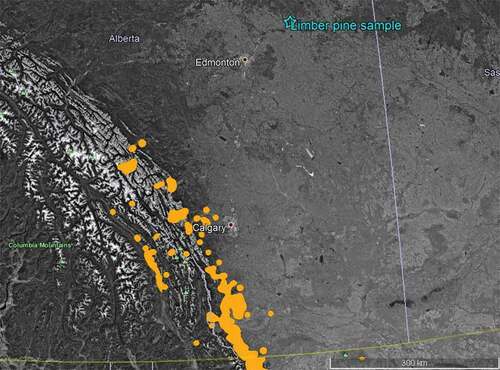
Fig. 2 Severity of Dothistroma infection by species and year at Smoky Lake, Alberta by observation year
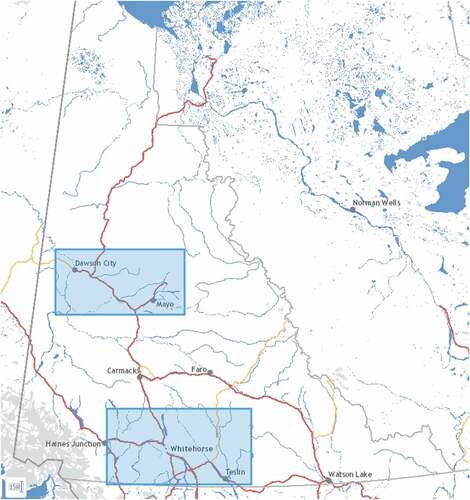
Table 1. A summary of diseases observed during surveys on cereal, oilseed and vegetable crops in the Yukon Territory in 2020
Fig. 1 A map of the Yukon Territory showing areas where crop production is concentrated. The 2020 crop disease survey was conducted in fields in the Whitehorse area