Figures & data
Table 1. Recovery of species of Botrytis, Sclerotinia, Diaporthe and Fusarium from cannabis and hemp inflorescences and stems on plants grown in British Columbia during 2019–2020
Fig. 1 (Colour online) Development of bud rot, caused by Botrytis cinerea, on cannabis inflorescences. a, Early symptom of an infected bract leaf turning yellow (arrow). b, Spread of the pathogen to several bract leaves (arrow). c, Necrotic areas on the inflorescences (arrow) due to pathogen spread. d, e, Internal decay due to pathogen development internally within the inflorescence. f, g, Sporulation of B. cinerea on infected tissues showing the characteristic grey mould symptom. h–j, Stem cankers developing at different locations on the plant
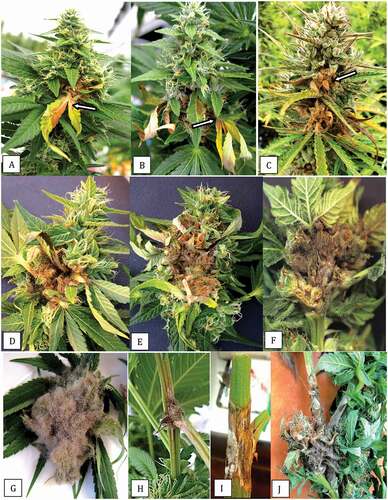
Fig. 2 (Colour online) Advanced symptoms of Botrytis infection on cannabis inflorescences. a, Healthy inflorescence of strain ‘Hash plant’ with prolific development of bract leaves along the length of the flower stalk. b, Extensive bud rot that originated with infected bract leaves and subsequently spread along the inflorescences of ‘Hash plant’. c, Healthy inflorescence of strain ‘Pink Kush’ with abundant bract leaves. d, Extensive bud rot development on ‘Pink Kush’ with the entire inflorescence having succumbed to infection. e, Early symptom of infection of bract leaves of hemp grown under outdoor conditions due to B. cinerea. f, Spread of the pathogen onto inflorescences of adjacent plants. g, Extensive sporulation of B. cinerea on a diseased hemp inflorescence on an outdoor plant
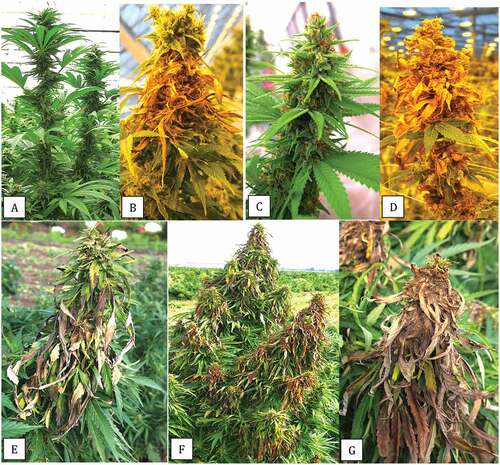
Fig. 3 (Colour online) Colony and spore characteristics of Botrytis species recovered from cannabis plants. a, Mycelial growth from surface-sterilized bud rot samples plated on potato dextrose agar after 5 days. b, Mycelial growth, sporulation and sclerotial formation after 2 weeks of growth from a stem canker sample. c, Variation in colony morphology, pigmentation, sporulation and sclerotial formation among four isolates of B. cinerea originating from bud rot-infected cannabis plants. Photo was taken after 3 weeks. d, Comparison of colony morphology and sclerotial formation of three species of Botrytis recovered from bud rot samples. From upper left – Bc (can) = B. cinerea from cannabis; Bc (hem) = B. cinerea from hemp. From lower left – B ps = B. pseudocinerea from cannabis; B po = B. porri from cannabis. (e–g) Comparison of conidia morphology of 3 species of Botrytis. e, Bc (can) = B. cinerea; f, B ps = B. pseudocinerea; g, B po = B. porri.
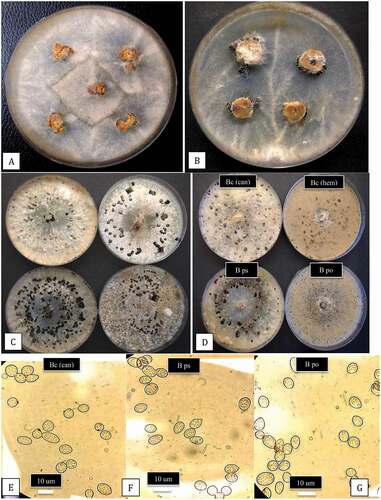
Fig. 4 Scanning electron micrographs of conidiophores and conidia of two Botrytis species originating from cannabis plants. Conidiophores of B. cinerea (a, c) and B. porri (b, d) showing differences in branching pattern. Comparison of conidial morphology of B. cinerea (e, g) and B. porri (f, h). Botrytis cinerea has a smooth surface and smaller conidial size compared to B. porri. All images were taken from 2-week-old cultures of both species grown on PDA under identical conditions
Fig. 5 PCR gel electrophoresis of 12 isolates of B. cinerea after amplification with the following primers: a, ITS1-5.8S-ITS2 region of rDNA producing a band size of approx. 650 bp; b, the glyceraldehyde-3-phosphate dehydrogenase (G3PDH) gene producing a band size of approx. 1050 bp; c, the heat shock 60 (HSP) gene producing a band size of approx. 1100 bp. Failed reactions can be seen in lanes 10 and 12 of (c)
Fig. 6 (Colour online) Growth and pathogenicity of three Botrytis species recovered from cannabis inflorescences. a, Colonization of buds after 7 days of incubation under laboratory conditions. Top row = B. cinerea, middle row = B. pseudocinerea; bottom row = B. porri. b, Disease severity ratings of the three Botrytis species. Data are from three separate experiments, each with six buds. Significant differences are indicted from analysis using ANOVA followed by Fisher’s LSD test at P < 0.01. c, Effect of temperature on colony growth of three Botrytis species. Data are the means from two experiments, each with five replicates. Standard errors are indicated. d, Comparison of radial growth of three Botrytis species after 7 days at 10°C. Top left = B. cinerea from cannabis; top right = B. cinerea from hemp; bottom left = B. pseuodocinerea from cannabis; bottom right = B. porri from cannabis
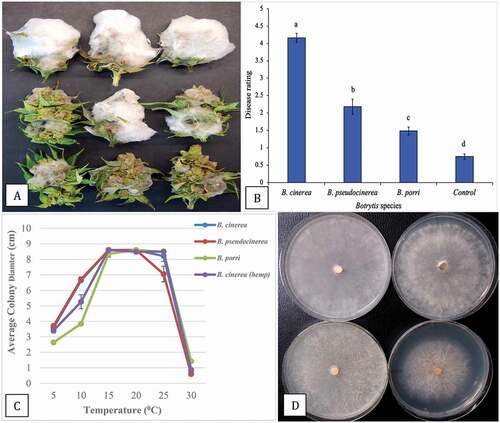
Fig. 7 (Colour online) Symptoms of bud rot on cannabis inflorescences caused by Sclerotinia sclerotiorum. a, b, Necrosis of tissues and development of white mycelium (arrows) and sclerotial initials. c, Advanced bud decay and development of sclerotia (arrow). d, Stem canker with abundant mycelial growth and sclerotial formation after incubation in a moist environment for several days. e, Recovery of colonies from bud rot-infected tissues and sclerotial development. f, Pure culture of S. sclerotiorum showing concentric pattern of sclerotial development. g, Infection of stem cuttings in a pathogenicity assay showing collapse of cuttings and mycelial growth on stems. h, Pathogenicity assay on detached cannabis inflorescences showing development of white mould and extensive decay of tissues
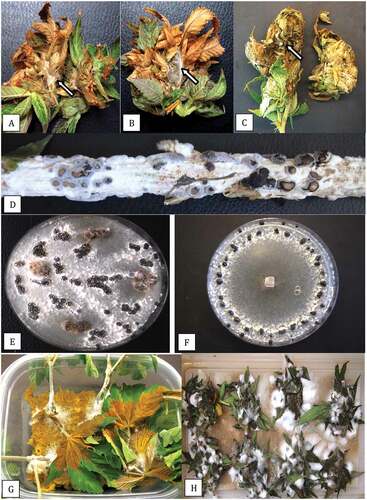
Fig. 8 (Colour online) Symptoms of bud rot on cannabis inflorescences caused by Diaporthe (Phomopsis). a, Necrosis of tissues and bud decay. b, Stem lesion on hemp plant at a wound site. c, d, Recovery of Diaporthe (dark mycelium) and Botrytis (brown mycelium) from the same bud rot samples. e–g, Pure cultures of Diaporthe with large numbers of pycnidia seen in (g). h, Spore masses produced from pycnidia in culture. i, Scanning electron micrograph of pycnidia showing extrusion of spore mass (arrow). j, Masses of beta-conidia of Phomopsis from pycnidia seen in (h). k, l, Mycelial growth and pycnidia formation on cannabis stem 3 weeks after inoculation with a mycelial plug of D. eres.
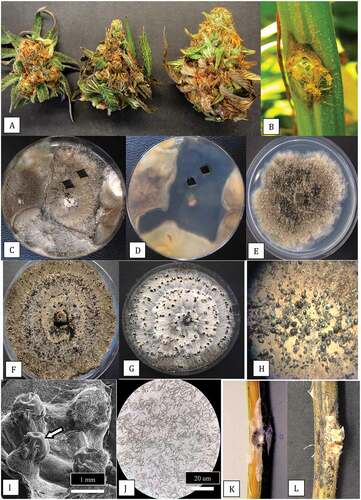
Fig. 9 (Colour online) Symptoms of bud rot on cannabis inflorescences and stem canker caused by Fusarium graminearum. a, b, Naturally infected inflorescences on indoor grown plants of cannabis showing prolific whitish-pink mycelial growth over the bract leaves and internal tissues. c, Healthy inflorescence with abundance of bract leaves. d, Recovery of F. graminearum from bud rot samples on PDA after 7 days. e, f, Symptoms of yellowing and wilt and dark sunken stem canker on hemp plant grown outdoors from which F. graminearum was recovered. g, Pathogenicity assay on detached bud showing prolific mycelial growth after 5 days. h, i, Pathogenicity assay on stem cuttings showing mycelial colonization of stem tissues after 5 days (h) and complete collapse after 10 days (i)
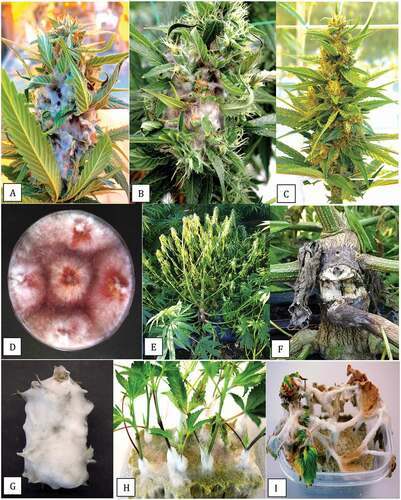
Fig. 10 (Colour online) In vitro antagonism assays conducted on PDA to demonstrate the interactions between three biocontrol microbes with Botrytis cinerea and Sclerotinia sclerotiorum. a, b, Inhibition of mycelial growth of B. cinerea by Bacillus amyloliquefaciens after 7 days (a) and 2 weeks (b). c, Development of a pronounced zone of inhibition between B. amyloliquefaciens and S. sclerotiorum after 2 weeks. d, e, Growth of Trichoderma asperellum (top) towards B. cinerea (bottom) showing the interaction at 7 days (d) and 2 weeks (e) where the biocontrol agent has overgrown the pathogen colony. f, Overgrowth of colony of S. sclerotiorum by T. asperellum after 2 weeks and colonization of sclerotia. g, h, Interactions between Gliocladium catenulatum and B. cinerea showing development of a zone of inhibition (g) and sporulation of the biocontrol and pathogen colonies after 2 weeks (h). i, Minimal interactions between G. catenulatum and S. sclerotiorum after 2 weeks in dual culture
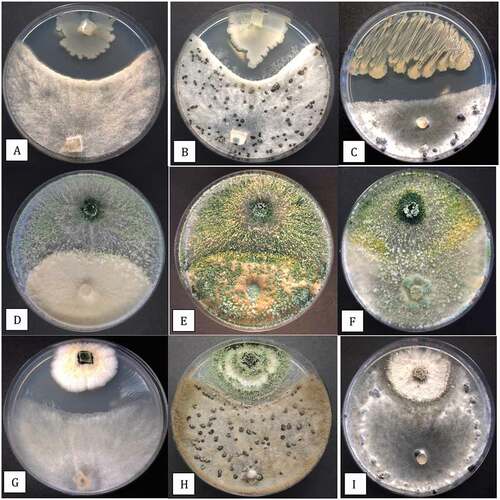
Fig. 11 (Colour online) Effect of biocontrol treatments on development of Botrytis cinerea on detached buds of cannabis after 7 days. Treatments were applied 48 h prior to inoculation with the pathogen. a, Control buds showing extensive mycelial development. b, Buds treated with Trichoderma asperellum. c, Buds treated with Bacillus amyloliquefaciens. d, Buds treated with Gliocladium catenulatum. e, Sporulation of G. catenulatum on treated buds after 10 days. f, g, Recovery of colonies of G. catenulatum from a streaked sample or dilution plating, respectively, originating from treated buds. h, Disease severity ratings made 7 days after inoculation with B. cinerea (control) or following pre-treatment 48 hr before pathogen inoculation with various biocontrol agents (Prestop, Asperello, Stargus). Data are the means from four experiments, each with four–six buds. Letters above bars denote significant differences using ANOVA followed by Fisher’s LSD test at P < 0.01
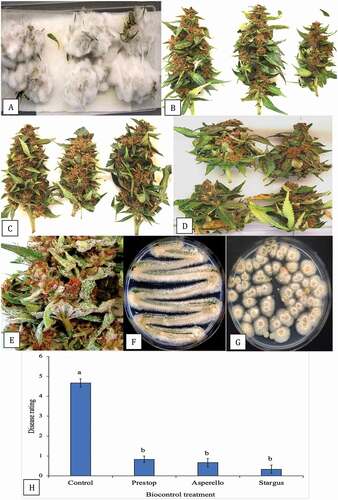
Fig. 12 Scanning electron micrographs of cannabis bud samples treated with Trichoderma asperellum or Gliocladium catenulatum and incubated for 10 days prior to sample collection. a–c, Mycelial growth, sporulation and spore production by T. asperellum on cannabis tissues. d, e, Sporulation of G. catenulatum showing spore clusters (balls) on cannabis bract leaves. f, Close-up of a verticilliate conidiophore and spore ball. g, h, Conidiophores, spore balls and spore masses of G. catenulatum produced on cannabis bract leaves. In (g), a trichome gland can be seen in the background. i, j, Masses of spores exuded from conidiophores of G. catenulatum that cover the surface of cannabis tissues
Fig. 13 (Colour online) Observations of glandular trichomes on bract leaves of cannabis buds and the occurrence of fungal propagules associated with the trichome glands. a, Young developing inflorescence showing bract leaves (arrow) surrounding a cluster of pistils in which the protruding white stigmas can be seen. b, Mature inflorescence showing fully developed bract leaves covered by glandular trichomes (arrow) that appear visually as white flecks. c, Scanning electron micrograph of glandular trichomes showing the head (arrow) and stalk developing on the bract surface. d, Same as (c) but glandular trichome heads and stalks are covered with spores of Penicillium (arrow). e, Close-up of the glandular head of a trichome showing spores of Penicillium (arrow) and Cladosporium adhered to the trichome gland surface. f, Spores (arrow) and a conidiophore of Penicillium on the surface of a trichome gland. g, Collapsed gland of a mature trichome (arrow) from which resin has been extruded. h, Spores of Aspergillus stuck to the resin extruded from cannabis trichome glands
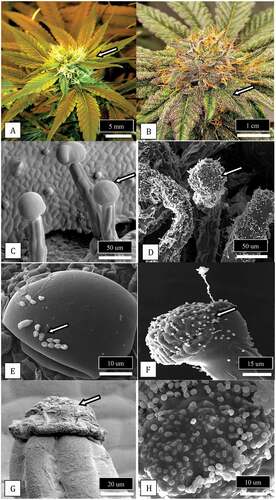
Fig. 14 (Colour online) Comparison of plant growth habit and bract leaf development on two strains of cannabis that differ in their response to Botrytis bud rot development. a, Strain ‘D. Bubba’ that shows flowering branches with fewer bract leaves at the top b, A top view of an individual inflorescence that shows the distribution of bract leaves emerging from the sides of the inflorescence. c, A side view of the same inflorescence showing the scarcity of bract leaves. d, Strain ‘Pink Kush’ showing an abundance of bract leaves on flowering branches that progress all the way to the top. e, A top view of an individual inflorescence that shows the distribution of bract leaves emerging from the sides of the inflorescence. f, A side view of the same inflorescence showing an abundance of bract leaves. This strain develops a more consistent and higher level of bud rot compared to strain ‘D. Bubba’
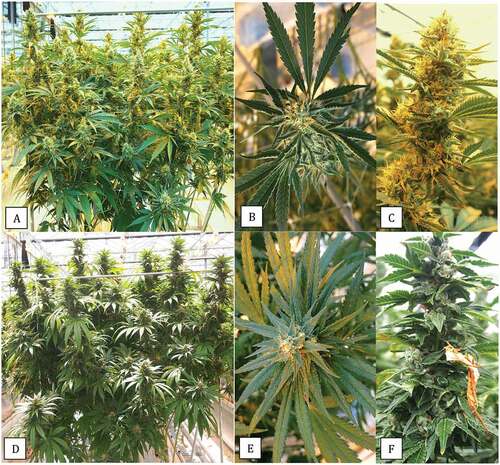
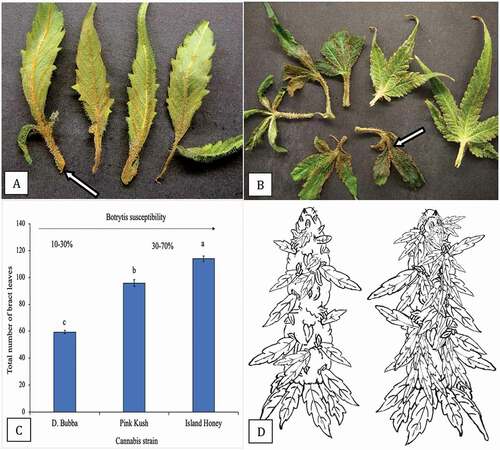
Fig. 15 (Colour online) Infection of bract leaves by Botrytis cinerea. a, Early infection at the base of bract leaves showing necrosis. b, Advanced infection of bract leaves where the pathogen has progressed from the base onto the bract leaf itself (arrow). These bracts were obtained from naturally infected inflorescences as shown in . c, Numerical representation of total number of bract leaves on three strains of cannabis. Total numbers were obtained by removing and counting each bract leaf on a total of 10 inflorescences of each strain. Means and standard deviations are shown. The strain least susceptible to Botrytis bud rot (range of 10–30%) is ‘D. Bubba’, the strains most susceptible to the pathogen are ‘Pink Kush’ and ‘Island Honey’ (range of 30–70%). d, Schematic representation of number of bract leaves on an inflorescence of two cannabis strains. On the left is ‘D. Bubba’, on the right is ‘Pink Kush’