Figures & data
Fig. 1 Symptoms of powdery mildew infection caused by Podosphaeria macularis on cannabis strain ‘Chronic Ryder’ on field grown plants in the Fraser Valley of British Columbia. Note the development of localized mildew colonies (a-c) and severe infection of young developing shoots (d, e) causing leaf curl. Older mildew colonies have a light beige centre (f).
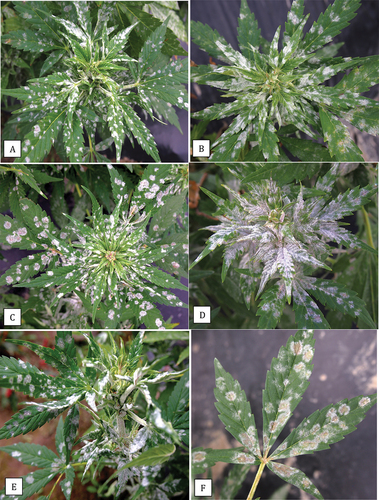
Fig. 2 Comparison of symptoms of powdery mildew caused by Podosphaeria macularis on leaves of field grown cannabis ‘Chronic Ryder’ (a-c), Golovinomyces ambrosiae on leaves of greenhouse grown cannabis ‘White Rhino’ (d-f) and P. macularis on greenhouse (g) and field-grown hop leaves (h, i). Colonies of P. macularis on cannabis developed a beige-coloured centre and there was evidence of necrosis (c). Colonies of G. ambrosiae were white and effuse (f) while P. macularis on hop leaves developed blister-like colonies (i). Image shown in (g) was provided by Katherine Sims.
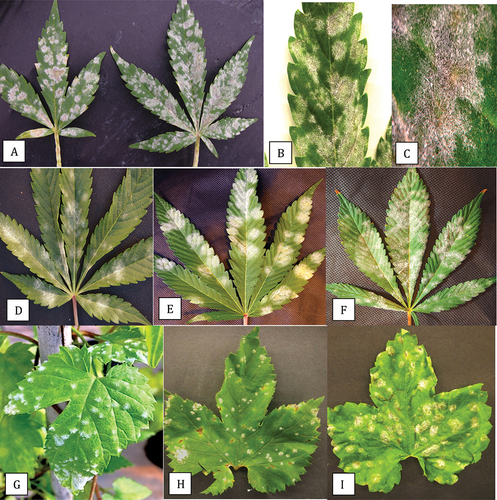
Fig. 3 Powdery mildew symptoms on hop cones and leaves caused by Podosphaeria macularis. On cones, prolific sporulation was observed (a, b) and was accompanied by tissues necrosis of the bracts (c). On leaves, colonies developed various shades of light beige pigmentation (d-f).
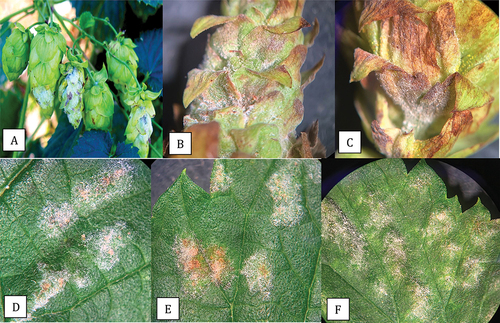
Fig. 4 PCR analysis of samples originating from cannabis and hop leaf tissues infected with powdery mildew using universal eukaryotic primers for the ITS1-5.8S-ITS2 region of ribosomal DNA. (a) Cannabis leaf tissues infected by Podosphaeria macularis (lane 1) showing amplification of plant DNA (band at ca. 750 bp labelled ‘a’) and pathogen DNA at ca. 650 bp (labelled ‘b’). Lanes 2 and 3 = Banding pattern from leaf tissues infected by Golovinomyces ambrosiae showing a band at ca. 700 bp corresponding to fungal DNA (labelled ‘c’). Lane 4 = Leaf tissues infected by P. macularis. Lane 5 = Healthy leaf tissues. Lane 6 = Leaf tissues infected by G. ambrosiae. Lane 7 = control (no DNA). (b) Lanes 1 and 2 = Young leaf tissues infected by G. ambrosiae. Lanes 3 and 4 = Old leaf tissues infected by G. ambrosiae. Lanes 5 and 6 = Hop leaves infected by P. macularis showing band at ca. 650 bp corresponding to pathogen DNA (labelled ‘c’). Lanes 7–10 = Old cannabis leaves heavily infected by P. macularis. Lanes 11 and 12 = Young cannabis leaves with small colonies of P. macularis. Lane 13 = control (no DNA).
Fig. 5 Phylogenetic analysis of 3 isolates of Podosphaeria macularis originating from cannabis and hop plants in this study from British Columbia (BC) (marked with▲) using ITS1-ITS2 sequences compared to isolates from hops in different geographic regions (GenBank numbers are shown). The evolutionary history was inferred using the Neighbour-Joining method. The percentage of replicate trees in which the associated taxa clustered together in the bootstrap test (1000 replicates) are shown next to the branches. The tree is drawn to scale, with branch lengths in the same units as those of the distances used to infer the phylogenetic tree. The distances were computed using the Maximum Composite Likelihood method and are in the units of the number of base substitutions per site. The analysis involved eight nucleotide sequences. All positions containing gaps and missing data were eliminated. Evolutionary analyses were conducted in MEGA7 (Kumar et al. Citation2016). The outgroup used was Sclerotinia sclerotiorum.
Fig. 6 Phylogenetic analysis of seven isolates of Golovinomyces ambrosiae originating from cannabis plants in this study from different geographic regions in British Columbia (BC) (marked with▲) using ITS1-ITS2 sequences compared to isolates from different hosts and geographic regions (GenBank numbers are shown). The evolutionary history was inferred using the Neighbour-Joining method. The tree is drawn to scale, with branch lengths in the same units as those of the distances used to infer the phylogenetic tree. The distances were computed using the Maximum Composite Likelihood method and are in the units of the number of base substitutions per site. The analysis involved 20 nucleotide sequences. All positions containing gaps and missing data were eliminated. Evolutionary analyses were conducted in MEGA7 (Kumar et al. Citation2016). The outgroup used was Sclerotinia sclerotiorum.
Fig. 7 Light microscopic images of spores of Podosphaeria and Golovinomyces from cannabis, squash and hop plants. Clear sticky cellophane tape was gently pressed onto the leaves and transferred to a microscope slide which was examined under a compound microscope at various magnifications for characteristics of conidia and chains. (a, b) Conidia and chains of P. macularis from cannabis plants ‘Chronic Ryder’. (c, d) Conidia and chains of P. xanthii from squash plants. (e, f) Conidia of P. macularis from hop leaves. (g, h) Conidia of G. ambrosiae from cannabis leaves.
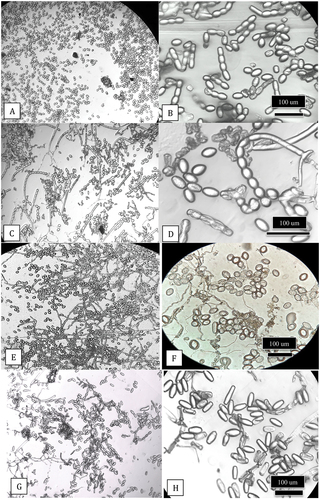
Fig. 8 Scanning electron microscopic images of conidia of Podosphaeria and Golovinomyces from cannabis and hop plants. (a, b) Conidia of P. macularis from cannabis plants ‘Chronic Ryder’. (c-e) Conidia of P. macularis from hop leaves. (f) Conidia of G. ambrosiae from cannabis leaves.
Fig. 9 (a-d) Symptoms on cannabis plants ‘Pink Kush’ inoculated with powdery mildew originating from cannabis ‘Chronic Ryder’ (Podosphaeria macularis). Progression of the disease was observed from 12 to 35 days following inoculation. (a) At 12 days, colonies (arrows) can be seen. (b) Mildew colony at 18 days after inoculation. (c) Mycelial growth with strands developing at 24 days. (d) Spread of mycelium and darkening of affected area after 35 days. Images a-d were taken from two symptomatic plants. The presence of P. macularis was confirmed by PCR (see Fig. 10). (e) Method used for transmission of powdery mildew from a diseased cannabis plant to a hop plant. The cannabis plant with powdery mildew colonies (arrow) was placed under the canopy of a hop plant. (f) The same hop plant after two months of growth in the greenhouse. Infection was not observed on the hop plant.
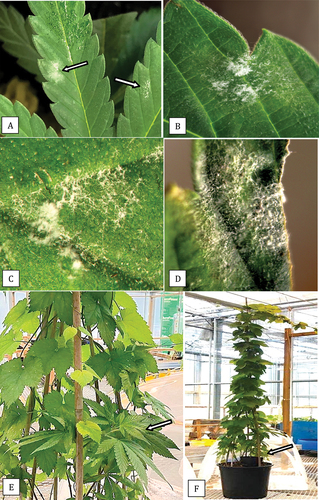
Fig. 10 PCR analysis using universal eukaryotic primers for the ITS1-5.8S-ITS2 region of ribosomal DNA of samples of cannabis leaves infected with powdery mildew caused by Golovinomyces ambrosiae or Podosphaeria macularis following artificial inoculation. Lane 1 – healthy control showing amplification of plant DNA (band at ca. 750 bp). Lanes 2 and 4 = Leaf infected with G. ambrosiae showing a band at ca. 700 bp corresponding to fungal DNA. Lane 3 = Leaf infected by P. macularis showing a band at ca. 650 bp corresponding to fungal DNA . Lane 5 – control (no DNA).