Figures & data
Fig. 1 Disease response in watermelon against PRSV-W. Symptom expression on a resistant (PI 244019) and susceptible plant (‘Charleston Gray’) 3 weeks following virus inoculation. The susceptible plant shows mosaic, chlorosis, and distorted leaf symptoms in (a) detached leaves; results from an (b) showed absorbance associated with the virus titre using a PRSV-W ELISA kit (Agdia).
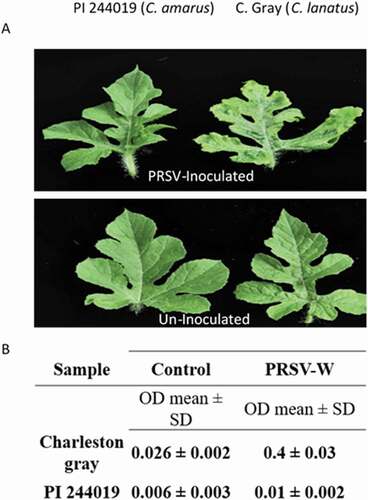
Table 1. List of primers used for the study of ribosome-inactivating protein (RIP) genes in watermelon.
Table 2. The types of RIP-like sequences, their associated genes and chromosomal locations as identified in the genome of the watermelon cv. ‘Charleston Gray’.
Fig. 2 Alignment of RIP-like sequences identified in the genome of the watermelon cv. ‘Charleston Gray’ and their predicted secondary structures (pink and the blue regions). The top bar indicates the consensus sequence. All the disagreements with the consensus sequence are indicated with colours, with A: red; C: blue; G: yellow and T: green. The grey regions indicate the sequences in agreement. The red bar indicates the signal peptide, and the green bars indicate RIP domain, lectin domain and unknown C-terminal domain. Eight-RIP-like proteins were identified in the genome of ‘Charleston Gray’ and were assigned to three distinct RIP type groups: RIP-I (C1CG11G001040, C1CG08G004120, C1CG08G004130, C1CG08G004150); RIP-II (C1CG09G009010, C1CG08G004200) and non RIP (C1CG08G004160, C1CG05G009670).
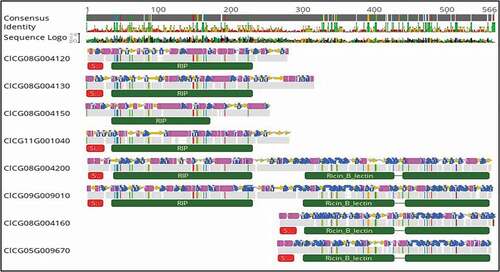
Fig. 3 Phylogenetic analysis of watermelon RIPs in relationship with some selected representative RIPs from other plant species. A phylogenetic tree was constructed using the neighbour joining (NJ) algorithm based on the amino acid sequence of RIP-like sequences identified from the genome of the watermelon ‘Charleston Gray’ (http://cucurbitgenomics.org/). The watermelon RIP genes are represented by their respective sequence IDs. Amino acid sequences of the selected representative RIP-I and RIP-II were derived from GenBank (https://www.ncbi.nlm.nih.gov/genbank/), Trichosanthes anguina (snake gourd) RIP-I Trichoanguin (GenBank Accession No. P56626.2) and RIP-II Nigrin b (Sambucus nigra; GenBank Accession No. U41299.1).
Table 3. Pairwise sequence analysis indicating the similarity in the amino acid sequences of the RIP-I and RIP-II proteins.
Table 4. Pairwise analysis of amino acid sequence identity and similarity between the watermelon RIPs with their representative RIP-I, Trichoanguin (Trichosanthes anguina) or RIP-II, Ricin (Ricinus communis).
Fig. 4 Identification of RIP-I and RIP-II in Citrullus amarus. A. Gene orthologues of RIP-I gene (C1CG08G004130) and RIP-II (C1CG09G009010) from the watermelon cv. ‘Charleston Gray’ were identified in C. amarus (PI 244019) in the cucurbit genomics database ‘CuGenDB’ (http://cucurbitgenomics.org/) and were aligned with Geneious Prime software with the Geneious alignment tool to compare the similarity between the genes visually. B. Pairwise analysis of nucleotide sequence identity between C. lanatus and C. amarus RIPs.
Fig. 5 Comparative evaluation of tissue-specific expression of RIP-I and RIP-II in watermelon. Quantitative real time RT-PCR was used to compare the relative expression of RIP-I and RIP-II gene transcripts in different tissues in the watermelon ‘Charleston Gray’. The levels of the RIP-I and RIP-II mRNA was normalized with actin in each sample. The standard deviation (SD) was derived from three biological replicates. Statistical analysis using two-way ANOVA was followed by Fisher’s LSD (α = 0.05) test to analyse the level of significance between different tissues and the control germinating seed. Significantly different treatments are designated with asterisks; ‘***’, adjusted p-value ≤ 0.0001; ‘****’, adjusted p-value < 0.00001; and ‘ns’, not significant.
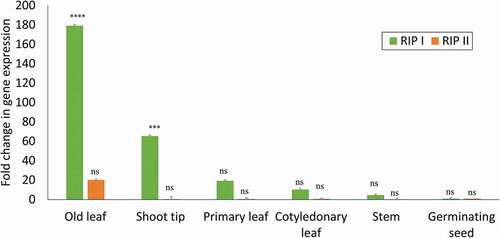
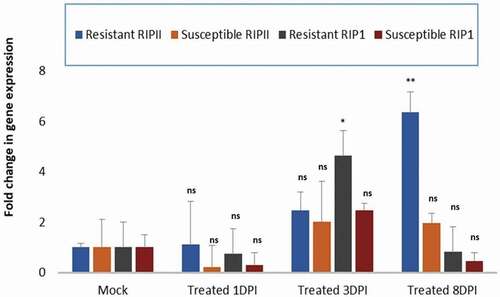
Fig. 6 Comparison of differential plant responses in watermelon plants resistant or susceptible to PRSV-W infection. Real-time quantitative PCR expression analysis of RIP-I and RIP-II genes in the PRSV-W-inoculated-resistant Citrullus amarus ‘PI 244019ʹ and the susceptible watermelon ‘Charleston gray’ at 1, 3- and 8-days post inoculation (dpi). The data were normalized against the actin gene. The standard deviation (SD) was derived from three biological replicates. Statistical analysis using two-way ANOVA was followed by Fisher’s LSD (α = 0.05) test to analyse the level of significance between the mock-control and the different treatments. Significantly different treatments are designated with asterisks; ‘*’, adjusted p-value ≤ 0.01; ‘**’, adjusted p-value ≤ 0.001; and ‘ns’, not significant.