Figures & data
Fig. 1 Total ion chromatogram (TIC) and extracted ion chromatogram (EIC) (left panel) and HR-mass spectra (right panel) of DON, DON-3G and 15-ADON standards (a) and a representative extract from a CO449 kernel sample (b).
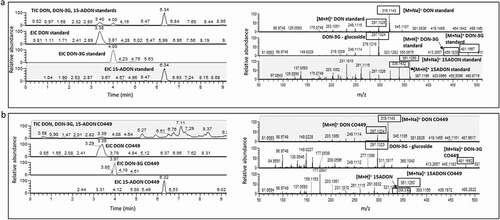
Table 1. Estimates of variance components, heritability and mean performance of inbred lines for ERK, DON, DON-3G and molar ratio of DON-3G:DON combined over two field test years (2015–2016).
Fig. 2 DON-3G:DON molar ratio and concentrations of DON (a) and DON-3G (b) in manually inoculated maize kernels (2015 and 2016 combined, n = 12). Maize inbreds are ordered by Gibberella ear rot (GER) disease severity, from low to high (left to right). Left axis: average DON or DON-3G (mg kg−1); Right axis: DON-3G:DON % molar ratio. Error bars represent standard deviation.
Table 2. Comparing DON and modified DON content in the most Gibberella ear rot-susceptible and resistant inbreds via kernel inoculation. The ERK (ear rot kernel) disease rating is based on a visual rating scale ranging from 1 (no visible infection) to 7 (heavily infected).
Fig. 3 Linear relationships of Gibberella ear rot kernel (ERK) disease rating with DON content (a), ERK disease rating with DON-3G content (b), ERK disease rating with DON-3G:DON molar ratio (c), DON-3G content with DON-3G:DON molar ratio (d), DON content with DON-3G:DON molar ratio (e), and DON-3G with DON content (f) in kernels of manually inoculated maize inbred ears. Mean values for each inbred are represented by open triangles for the three most Gibberella ear rot-tolerant inbreds, open squares for the three most susceptible inbreds and black circles for the remaining inbreds.