Figures & data
Fig. 1 Brown lesions on rosebuds and morphological features of Botrytis sp. and Alternaria sp. found in infected rosebuds. (a) Blight-like lesions in rosebuds selected for fungal isolation. (b) Fungal colony after eight days of growth on PDA, reverse and front view of the Petri dish corresponding to type I isolates (Botrytis sp.). (c) Fungal colony after eight days of growth on PDA, reverse and front view of the Petri dish corresponding to type II isolates (Alternaria sp.) (d) Microscopic examination of mycelium and conidia at 400x magnification corresponding to Botrytis sp. isolates. (e) Microscopic examination of mycelium and conidia at 400x magnification corresponding to Alternaria sp. isolates.
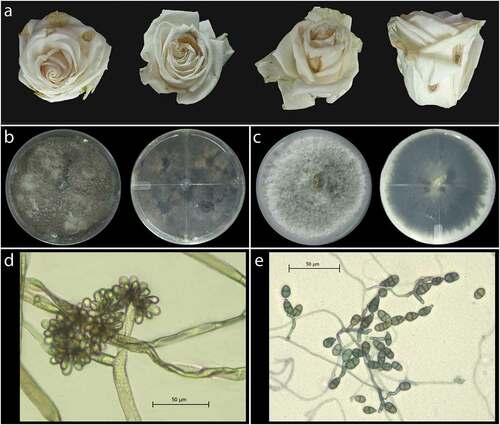
Fig. 2 Bayesian inference phylogenetic tree built using concatenated sequences of the ITS, RBP2, and TEF1 gene regions in Beast v1.8.4. Bayesian posterior probability values ≥0.5 are shown above the branches. Fungal species names are listed along with the host plant genus and country of origin. Species delimitations are indicated with grey boxes. Stemphylium vesicarium was used as an outgroup. The scale bar indicates the number of expected changes per site. The sequence found in this study is presented in bold.
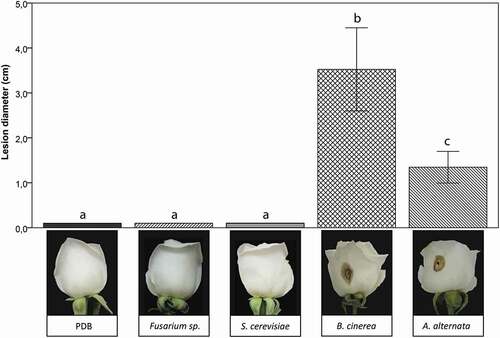
Fig. 3 Pathogenicity test of Alternaria alternata on the rose cultivar ‘Vendela’. (a) Lesion diameter produced by A. alternata 5 days post-inoculation. Positive (Botrytis cinerea) and negative controls (PDB solution, Fusarium sp., and Saccharomyces cerevisiae) are also shown. The upper bars indicate standard deviation. Different lower case letters indicate a significant difference (p < 0.05) using Tukey’s multiple-comparison following ANOVA (n = 10 inoculated buds each treatment). Five independent experiments were performed to validate the pathogenicity test. (b) Examples of roses following inoculation with the the different fungi or the PDB control.