Figures & data
Table 1. Information on strains, genomes, and lineage assignment.
Table 2. Information on loci, primer sets, and alignments.
Fig. 1 Maximum likelihood trees constructed from each of the three new candidate markers ASA-05, ASA-10, and ASA-19. Phylogenetic tree branches are colour-coded by main lineage (blue = alternata, red = longipes, green = arborescens, grey = gaisen). Taxa from the independent test set have taxon labels in bold and black. Taxa that were included in our previous phylogenomic analyses have colour-coded taxon labels, and strain names are followed by lineage names. Taxon labels with asterisks indicate strains that fell outside of the four main lineages, or have conflicting placement among the three loci. Branch support values are indicated above (ML bootstrap percentage) or below (Bayesian posterior probability) branches.
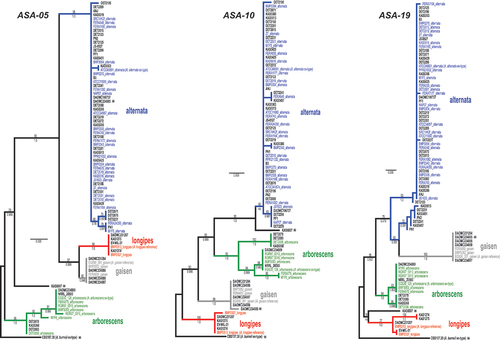
Fig. 2 Maximum likelihood tree constructed from the three new candidate markers combined (ASA-05, ASA-10, and ASA-19). Phylogenetic tree branches are colour-coded by main lineage (blue = alternata, red = longipes, green = arborescens, grey = gaisen). Taxa from the independent test set have taxon labels in bold and black. Taxa that were included in our previous phylogenomic analyses have colour-coded taxon labels, and strain names are followed by lineage names. Branch support values are indicated above (ML bootstrap percentage/multispecies coalescent posterior probability) or below (Bayesian posterior probability) branches. Values of ‘na’ indicate the branch was not present in the respective analysis.
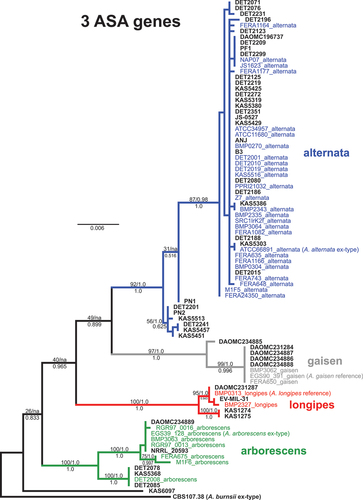
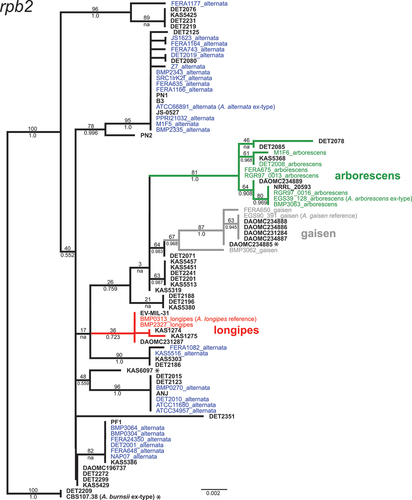
Fig. 3 Maximum likelihood tree constructed from the RNA polymerase II second largest subunit gene (rpb2). Phylogenetic tree branches are colour-coded by main lineage (red = longipes, green = arborescens, grey = gaisen). Taxa from the independent test set have taxon labels in bold and black. Taxa that were included in our previous phylogenomic analyses have colour-coded taxon labels, and strain names are followed by lineage names. Branch support values are indicated above (ML bootstrap percentage) or below (Bayesian posterior probability) branches.