
Figures & data
Fig. 1. Pie chart of genetic panel composition by the breeding institutions (Agriculture and Agri-Food Canada, Brandon Research and Development Centre [AAFC-BRDC]; Crop Development Centre [CDC]; Field Crop Development Centre [FCDC]; D = Busch Agricultural Resources, Inc. [Bari]; WestBred LLC/ Highland Specialty Grains [WB/HSG]; North Dakota State University [NDSU]; Agriculture and Agri-Food Canada, Lethbridge Research and Development Centre [AAFC-LeRDC]; Agriculture and Agri-Food Canada, Ottawa Research and Development Centre [AAFC-ORDC]; Molson Coors Beverage Company [COORS]; Agricore United [AU]; Accessions are landrace or exotic cultivars).
![Fig. 1. Pie chart of genetic panel composition by the breeding institutions (Agriculture and Agri-Food Canada, Brandon Research and Development Centre [AAFC-BRDC]; Crop Development Centre [CDC]; Field Crop Development Centre [FCDC]; D = Busch Agricultural Resources, Inc. [Bari]; WestBred LLC/ Highland Specialty Grains [WB/HSG]; North Dakota State University [NDSU]; Agriculture and Agri-Food Canada, Lethbridge Research and Development Centre [AAFC-LeRDC]; Agriculture and Agri-Food Canada, Ottawa Research and Development Centre [AAFC-ORDC]; Molson Coors Beverage Company [COORS]; Agricore United [AU]; Accessions are landrace or exotic cultivars).](/cms/asset/beb1f319-e0bb-43c5-a426-ae2e28b2fa4c/tcjp_a_2086925_f0001_oc.jpg)
Fig. 2. STRUCTURE Sub-population membership for 400 two-row barley grouped by breeding institution. A = Agriculture and Agri-Food Canada, Brandon Research and Development Centre (AAFC-BRDC); B = Crop Development Centre (CDC); C = Field Crop Development Centre (FCDC); D = Busch Agricultural Resources, Inc. (Bari); E = WestBred LLC/ Highland Specialty Grains (WB/HSG); F = North Dakota State University (NDSU); G = Agriculture and Agri-Food Canada, Lethbridge Research and Development Centre (AAFC-LeRDC); H = Agriculture and Agri-Food Canada, Ottawa Research and Development Centre (AAFC-ORDC); I = Molson Coors Beverage Company (COORS); J = Agricore United (AU); K = Accession. Yellow = Cluster 1 and Orange = Cluster 2. The Y axis represents the proportion of cluster (K = 2) membership.
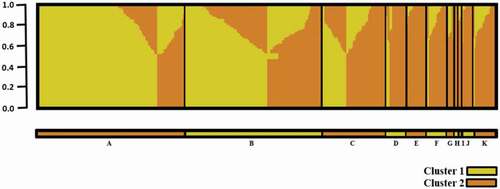
Fig. 3. Phylogenetic tree constructed by neighbor-joining (NJ) method based on single-nucleotide polymorphism (SNP) genetic markers (25 K) displaying selected cultivars and germplasm from the various institutions (Agriculture and Agri-Food Canada, Brandon Research and Development Centre [red]; Crop Development Centre [blue]; Field Crop Development Centre [green]; D = Busch Agricultural Resources, Inc. [purple]; WestBred LLC/ Highland Specialty Grains [Orange]; North Dakota State University [brown].
![Fig. 3. Phylogenetic tree constructed by neighbor-joining (NJ) method based on single-nucleotide polymorphism (SNP) genetic markers (25 K) displaying selected cultivars and germplasm from the various institutions (Agriculture and Agri-Food Canada, Brandon Research and Development Centre [red]; Crop Development Centre [blue]; Field Crop Development Centre [green]; D = Busch Agricultural Resources, Inc. [purple]; WestBred LLC/ Highland Specialty Grains [Orange]; North Dakota State University [brown].](/cms/asset/565beb1b-8a51-4e2c-a255-92d9b059127d/tcjp_a_2086925_f0003_oc.jpg)
Fig. 4. Plots of the first two principal components of genotype information (single-nucleotide polymorphism genetic markers) of the genomic panel with colouration highlighting A) malting or feed barley types; B) breeding institution origin (Agriculture and Agri-Food Canada, Brandon Research and Development Centre [AAFC-BRDC]; Crop Development Centre [CDC]; Field Crop Development Centre [FCDC]; D = Busch Agricultural Resources, Inc. [Bari]; WestBred LLC/ Highland Specialty Grains [WB/HSG]; North Dakota State University [NDSU]; Agriculture and Agri-Food Canada, Lethbridge Research and Development Centre [AAFC-LeRDC]; Agriculture and Agri-Food Canada, Ottawa Research and Development Centre [AAFC-ORDC]; Molson Coors Beverage Company [COORS]; Agricore United [AU]; Accessions are landrace or exotic cultivars).
![Fig. 4. Plots of the first two principal components of genotype information (single-nucleotide polymorphism genetic markers) of the genomic panel with colouration highlighting A) malting or feed barley types; B) breeding institution origin (Agriculture and Agri-Food Canada, Brandon Research and Development Centre [AAFC-BRDC]; Crop Development Centre [CDC]; Field Crop Development Centre [FCDC]; D = Busch Agricultural Resources, Inc. [Bari]; WestBred LLC/ Highland Specialty Grains [WB/HSG]; North Dakota State University [NDSU]; Agriculture and Agri-Food Canada, Lethbridge Research and Development Centre [AAFC-LeRDC]; Agriculture and Agri-Food Canada, Ottawa Research and Development Centre [AAFC-ORDC]; Molson Coors Beverage Company [COORS]; Agricore United [AU]; Accessions are landrace or exotic cultivars).](/cms/asset/4e727215-0dac-42b3-bddc-12a2252fb0f3/tcjp_a_2086925_f0004_oc.jpg)
Table 1. Means and standard errors of height (HT, cm), fusarium head blight (FHB, 0–5) and days to fifty percent heading (HD50, days) and deoxynivalenol (DON, mg kg−1) content over years and locations.
Table 2. Selection of germplasm with low Fusarium head blight (FHB) score or deoxynivalenol (DON) content. Numbers represent grand average over site years, with standard errors in brackets.
Fig. 5. Manhattan plots ofall site years of 400 genotypes for days to fifty-percent heading (HD50), height (HT), FHB (Fusarium head blight score) and deoxynivalenol content (DON) over the chromosomal position. The horizontal red dashed line represents a genome-wide significance threshold (-Log10 P-value ≥ 3.0). SNP markers are displayed cumulatively by chromosome (Chr) which are represented by colour.
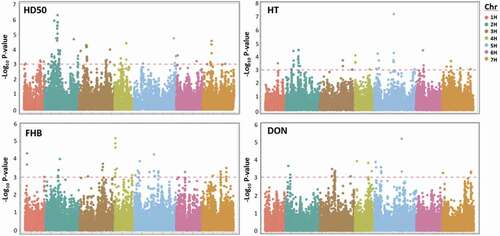
Table 3. Significant molecular markers (-Log10 [P value] ≥3) associated with Fusarium head blight (FHB) averaged over all site years (n = 6).
Table 4. Significant molecular markers (-Log10 [P value] ≥3) associated with deoxynivalenol (DON) content averaged over all site years (n = 6).
Supplemental Material
Download MS Word (410.4 KB)Supplementary_Table1.xlsx
Download MS Excel (41 KB)Data availability statement
The data discussed in this publication have been deposited in NCBI’s Gene Expression Omnibus (Edgar Citation2002) and are accessible through GEO Series accession number GSE188791 (https://www.ncbi.nlm.nih.gov/geo/query/acc.cgi?acc=GSE188791). LSMeans of phenotypic data are also available (Supplementary Table S1).