Figures & data
Fig. 1 (Colour online) Symptoms of crown gall caused by A. tumefaciens on naturally infected and artificially inoculated cannabis plants. (a) Gall development on roots of genotype ‘Sour Kush’. (b) Close-up of gall shown in (a). (c) Development of galls at the crown and roots of genotype SWD four weeks after artificial inoculation. (d, e) Galls at the crown of plants of genotype WHR resulting from natural infection. (f) Gall at the crown of a plant of genotype ‘Pink Kush’. (g) Galls on the middle stem of plants of genotype CPH following artificial inoculation. (h) Same as (g) but on genotype MBD. (i) Galls on the top of the stems of genotype SWD following artificial inoculation. (j) Same as (i) but on genotype HAP. (k) Same as (i) but on genotype CPH. Photos shown in I-L were taken 3 weeks after inoculation with A. tumefaciens.
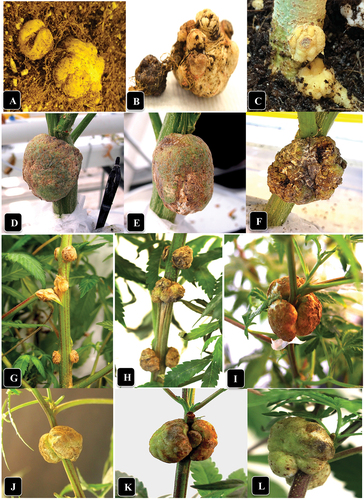
Fig. 2 (Colour online) Symptoms of crown gall caused by A. tumefaciens on naturally infected and artificially inoculated cannabis stem cuttings. (a) Gall development at the base of five cuttings in a propagation room (arrows). (b) Close-up of gall development. (c, d) Galls developing following artificial inoculation with A. tumefaciens after 7 days (c) and 14 days (d). (e) An inoculated cannabis plant shows no foliar symptoms as aresult of gall development at two sites. Photo was taken 4 weeks after inoculation. (f, g) Comparison of gall sizes on a cannabis plant genotype CPH following artificial inoculation with A. tumefaciens. the gall on the middle of the stem section is larger than on the crown.

Fig. 3 (Colour online) Growth of three bacterial genera recovered from crown gall tissues in this study on McConkey agar (a-d) and D1 medium (e-h) compared to A. tumefaciens showing colony appearance after 72 hr of incubation at 23°C. (a) A. tumefaciens ATCC 15955. (b) Pseudomonas migulae. (c) Enterobacter sp. (d) Kluyvera cryocrescens. (e) A. tumefaciens ATCC 15955. (f) Enterobacter sp. (g) Pseudomonas migulae. (h) Kluyvera cryocrescens.
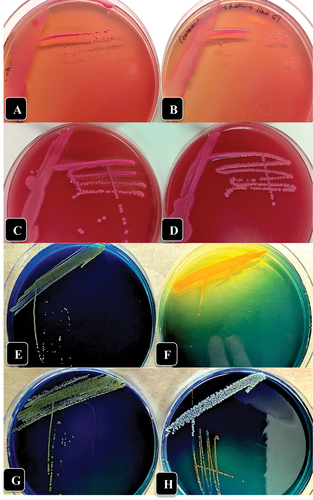
Table 1. Comparison of crown gall development on four genotypes of cannabis (Cannabis sativa L.) plants at 3 weeks post-inoculation at three inoculation sites.
Fig. 4 PCR analysis for presence of Agrobacterium in cannabis tissue samples using primers iaaH-F2 and iaaH-R1. (a) Lane L = 1 kb Plus DNA ladder; lane 1 = root gall sample A; lane 2 = crown gall sample C; lane 3 = ATCC 15955 positive control; lane 4 = cannabis genotype WHR negative control; lane 5 = artificially inoculated gall using ATCC 15955 on genotype CPH; lane 6 = cannabis genotype CPH negative control; lane 7 = artificially inoculated gall using ATCC 15955 on genotype SWD; lane 8 = cannabis genotype SWD negative control. Red arrows indicate sequences that were identified as Agrobacterium using NCBI BLAST. (b) Lane L = 1 kb Plus DNA ladder; lane 1 = ATCC 15955 positive control; lane 2 = artificially inoculated gall using ATCC 15955 on genotype CPH; lanes 3–8 = galls on stems from 6 different cuttings of genotype PNK; lane 9 = artificially inoculated gall using ATCC 15955 on genotype SWD. (c) PCR analysis using primers iaaH-F10 and iaaH-R10. Lanes 1 and 2 = root gall sample A; lane 3 = crown gall sample C of genotype WHR; lanes 4 and 5 = ATCC 15955 positive control; lanes 6 and 7 = cannabis genotype WHR negative control; lanes 8 and 9 = artificially inoculated gall using ATCC 15955 on genotype CPH; lanes 10 and 11 = cannabis genotype CPH negative control; lanes 12 and 13 = artificially inoculated gall using ATCC 15955 on genotype SWD; and lanes 14 and 15 = cannabis genotype CPH negative control. The red arrows indicate the size of highly amplified bands between positive and negative samples.
Fig. 5 Comparison of gall area caused by A. tumefaciens at various inoculation sites. Gall area was compared between each of the 3 inoculation sites (n = 22) using the data from all genotypes. The box of each dataset represents the interquartile range (IQR) which contains the 3rd quartile (Q3 - top side of the box), the median value of all data (the middle line), and the first quartile (Q1 - bottom side of the box). The bars represent the maximum (Q3 + 1.5 × IQR) and minimum (Q1–1.5 × IQR) of the data. Outliers are represented by data points below or above the minimum and maximum, respectively. An ANOVA resulted in a p > 0.05 and a Tukey’s HSD test showed significant differences between top/bottom gall areas and middle/bottom gall areas. No significant difference was found between top/middle gall areas.