
Figures & data
Table 1. Diseases/symptoms detected in cannabis samples submitted to the BCMAF PHL in 2023.
Table 2. Diseases/symptoms detected in floriculture samples submitted to the BCMAF PHL in 2023.
Table 3. Diseases/symptoms detected in forest nursery samples submitted to the BCMAF PHL in 2023.
Table 4. Diseases/symptoms detected in greenhouse vegetable samples submitted to the BCMAF PHL in 2023.
Table 5. Diseases/symptoms detected in berry and nut crop samples submitted to the BCMAF PHL in 2023.
Table 6. Diseases/symptoms detected in specialty crop and vertical farming samples submitted to the BCMAF PHL in 2023.
Table 7. Diseases/symptoms detected in tree fruit and grape samples submitted to the BCMAF PHL in 2023.
Table 8. Diseases/symptoms detected in field vegetable samples submitted to the BCMAF PHL in 2023.
Table 9. Diseases/symptoms detected in woody ornamental samples submitted to the BCMAF PHL in 2023.
Table 10. Diseases/symptoms detected in turf and grass samples submitted to the BCMAF PHL in 2023.
Table 11. Diseases detected in sweet cherry samples from the BC Southern Interior submitted to the BCMAF PHL for little cherry disease (LCD) testing in 2023.
Table 1. Diseases diagnosed on ornamental nursery and landscape plant samples submitted to Elmhirst Diagnostics & Research in 2023.
Table 2. Diseases diagnosed on field berry and greenhouse (GH) vegetable samples submitted to Elmhirst Diagnostics & Research in 2023.
Table 1. Diseases diagnosed on cereal samples submitted to the Alberta Plant Health Lab in 2023.
Table 2. Diseases diagnosed on canola samples submitted to the Alberta Plant Health Lab in 2023.
Table 3. Diseases diagnosed on potato samples submitted to the Alberta Plant Health Lab in 2023.
Table 4. Diseases diagnosed on forage legume and pulse samples submitted to the Alberta Plant Health Lab in 2023.
Table 5. Diseases diagnosed on tree and fruit samples submitted to the Alberta Health Lab in 2023.
Table 6. Diseases diagnosed on vegetable and herb samples submitted to the Alberta Plant Health Lab in 2023.
Table 1. Diseases and disorders diagnosed on cereal crop samples submitted to the Saskatchewan Crop Protection Lab in 2023.
Table 2. Diseases and disorders diagnosed on oilseed crop samples submitted to the Saskatchewan Crop Protection Lab in 2023.
Table 3. Diseases and disorders diagnosed on legume crop samples submitted to the Saskatchewan Crop Protection Lab in 2023.
Table 4. Diseases and disorders diagnosed on tree and fruit samples submitted to the Saskatchewan Crop Protection Lab in 2023.
Table 5. Diseases diagnosed on vegetable samples submitted to the Saskatchewan Crop Protection Lab in 2023.
Table 6. Diseases and disorders diagnosed on specialty crop and forage samples submitted to the Saskatchewan Crop Protection Lab in 2023.
Table 1. Diseases diagnosed on cereal and corn crop samples submitted to the Manitoba Agriculture Crop Diagnostic Centre in 2023.
Table 2. Diseases diagnosed on herbaceous annual, perennial, and woody ornamental shrub samples submitted to the Manitoba Agriculture Crop Diagnostic Centre in 2023.
Table 3. Diseases diagnosed on vegetable crop samples submitted to the Manitoba Agriculture Crop Diagnostic Centre in 2023.
Table 4. Diseases diagnosed on potato crop samples submitted to the Manitoba Agriculture Crop Diagnostic Centre in 2023.
Table 5. Diseases diagnosed on shelterbelt and ornamental tree samples submitted to the Manitoba Agriculture Crop Diagnostic Centre in 2023.
Table 6. Diseases diagnosed on oilseed crop samples submitted to the Manitoba Agriculture Crop Diagnostic Centre in 2023.
Table 7. Diseases diagnosed on fruit and berry crop samples submitted to the Manitoba Agriculture Crop Diagnostic Centre in 2023.
Table 8. Diseases diagnosed on pulse and legume crop samples submitted to the Manitoba Agriculture Crop Diagnostic Centre in 2023.
Table 1. Plant samples and associated diseases submitted to the OCRC-B diagnostic laboratory in 2023.
Table 1. Diseases diagnosed on vegetable samples (including greenhouse vegetables) submitted to the University of Guelph Plant Disease Clinic in 2023.
Table 2. Diseases diagnosed on fruit samples submitted to the University of Guelph Plant Disease Clinic in 2023.
Table 3. Diseases diagnosed on herbaceous ornamental samples submitted to the University of Guelph Plant Disease Clinic in 2023.
Table 4. Plant diseases diagnosed on woody ornamental samples submitted to the University of Guelph Plant Disease Clinic in 2023.
Table 5. Diseases diagnosed on field crop samples submitted to the University of Guelph Plant Disease Clinic in 2023.
Table 6. Diseases diagnosed on herb and specialty crop samples submitted to the University of Guelph Plant Disease Clinic in 2023.
Tableau 1. Sommaire des maladies diagnostiquées parmi les plantes maraîchères reçues au Laboratoire d’expertise et de diagnostic en phytoprotection du MAPAQ en 2023.
Tableau 2. Sommaire des maladies diagnostiquées parmi les arbres fruitiers et petits fruits reçus au Laboratoire d’expertise et de diagnostic en phytoprotection du MAPAQ en 2023.
Tableau 3. Sommaire des maladies diagnostiquées parmi les grandes cultures/céréales et cultures industrielles reçues au Laboratoire d’expertise et de diagnostic en phytoprotection du MAPAQ en 2023.
Tableau 4. Sommaire des maladies diagnostiquées parmi les plantes fourragères reçues au Laboratoire d’expertise et de diagnostic en phytoprotection du MAPAQ en 2023.
Tableau 5. Sommaire des maladies diagnostiquées parmi les arbres et arbustes ornementaux ou d’utilisation industrielle reçues au Laboratoire d’expertise et de diagnostic en phytoprotection du MAPAQ en 2023.
Tableau 6. Sommaire des maladies diagnostiquées parmi les plantes herbacées ornementales reçues au Laboratoire d’expertise et de diagnostic en phytoprotection du MAPAQ en 2023.
Tableau 7. Sommaire des maladies diagnostiquées parmi les plantes aromatiques et médicinales reçues au Laboratoire d’expertise et de diagnostic en phytoprotection du MAPAQ en 2023.
Table 1. Summary of diseases/symptoms diagnosed on fruit tree crop samples submitted to the NBDAAF Plant Disease Diagnostic Laboratory in 2023.
Table 2. Summary of diseases/symptoms diagnosed on berry and grape crop samples submitted to the NBDAAF Plant Disease Diagnostic Laboratory in 2023.
Table 3. Summary of diseases/symptoms diagnosed on vegetable (field and greenhouse) and basil crop samples submitted to the NBDAAF Plant Disease Diagnostic Laboratory in 2023.
Table 4. Summary of diseases/symptoms diagnosed on cereal crop samples submitted to the NBDAAF Plant Disease Diagnostic Laboratory in 2023.
Table 5. Summary of diseases/symptoms diagnosed on trees, shrubs and ornamental plant samples submitted to the NBDAAF Plant Disease Diagnostic Laboratory in 2023.
Table 1. Diseases diagnosed on commercial crop samples submitted to the PEI Analytical Laboratories, Plant Disease Diagnostic Service in 2023.
Table 1. Disease incidence and severity, based on percent leaf area diseased assessments of penultimate leaf samples in 103 commercial barley fields, Alberta, 2023.
Table 1. Prevalence and severity of fusarium head blight (FHB) in Saskatchewan barley crops in 2023 grouped by soil zone.
Table 2. Prevalence of Fusarium species in Saskatchewan barley crops displaying visual symptoms in 2023.
Table 1. Prevalence of different growth stages of the oat and barley crops surveyed and tillage operations under which these crops were grown in Saskatchewan in 2023.
Table 2. Prevalence and incidence of seed-isolated pathogens from oat in Saskatchewan in 2023.
Table 3. Prevalence and incidence of each leaf spot pathogen detected in oat and barley survey samples in Saskatchewan in 2023.
Table 1. Fusarium species isolated from kernels collected from barley fields in Manitoba in 2023.
Table 2. Fusarium species isolated from kernels collected from oat fields in Manitoba in 2023.
Table 1. Incidence and isolation frequency of leaf spot pathogens in barley in Manitoba in 2023.
Table 2. Incidence and isolation frequency of leaf spot pathogens in oats in Manitoba in 2023.
Fig. 1 Map illustrating surveyed cereal fields across southern Alberta in 2023. Clean fields are denoted by green pins, while fields infected with fungal leaf spots are marked with red pins. The yellow pin highlights the sole field where stripe rust was detected.
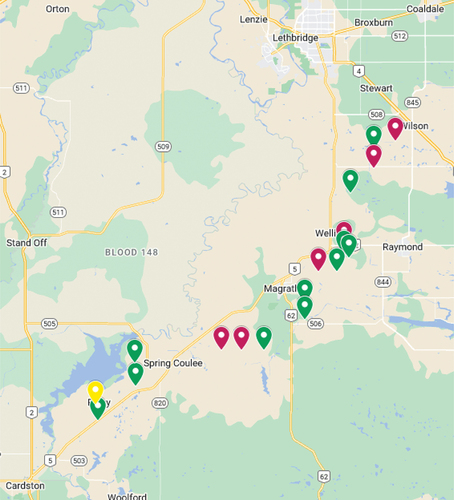
Table 1. Occurrence of fungal leaf spot and stripe rust diseases in 18 cereal fields surveyed during the 2023 growing season in southern Alberta.
Table 2. Stripe rust incidence on wheat and barley in southern Alberta from 2017 to 2023.
Table 1. Five-year summary of frequency (% PFS) and severity (mean % infection) of Fusarium graminearum and total Fusarium species on wheat, durum, barley and oat combined.
Table 2. Number of wheat samples tested from September 2022 to May 2023 and levels of infection with Fusarium graminearum and Fusarium spp. in each Saskatchewan crop district.
Table 3. Number of durum samples tested from September 2022 to May 2023 and levels of infection with Fusarium graminearum and total Fusarium spp. in each Saskatchewan crop district.
Table 4. Number of barley samples tested from September 2022 to May 2023 and levels of infection with Fusarium graminearum and total Fusarium spp. in each Saskatchewan crop district.
Table 5. Number of oat samples tested from September 2022 to May 2023 and levels of infection with Fusarium graminearum and total Fusarium spp. in each Saskatchewan crop district.
Table 6. Germination rates (%) of common and durum wheat, barley and oat from September 2022 to May 2023 in each Saskatchewan crop district.
Table 1. Summary of rust samples collected and infection rates found in sampled fields in Ontario and Québec in 2023.
Fig. 1 2023 Eastern Ontario corn disease survey sampling sites indicated by dot marks. Circles indicate where the severity of northern corn leaf blight was ≥ 5, and x’s where the incidence of pythium stalk rot was ≥ 20%.
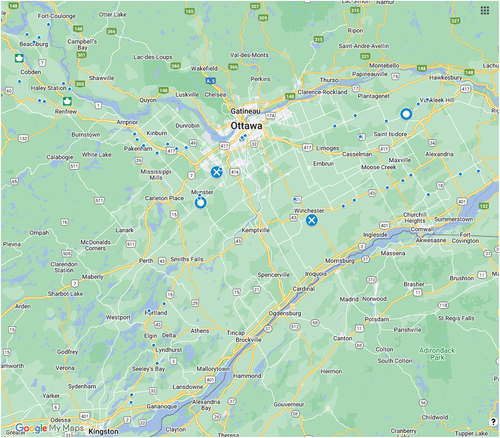
Table 1. Corn disease occurrence and severity or incidence in Eastern Ontario grouped by county.
Table 1. Frequencies (%) of virulence of Puccinia coronata f. sp. avenae isolates on 16 standard and eight supplemental crown rust differential oat lines from Manitoba, Saskatchewan, and Eastern Canada (Ontario and Quebec) in 2022.
Fig. 1 Wheat disease survey locations, and percent leaf area damaged (PLAD) categories, in Alberta in 2023.
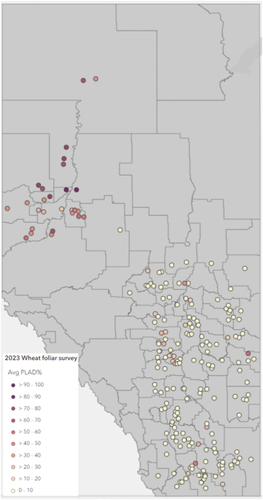
Fig. 2 Wheat disease survey locations (small grey dots), and locations where BLS was confirmed (large blue dots) in Alberta, 2023.
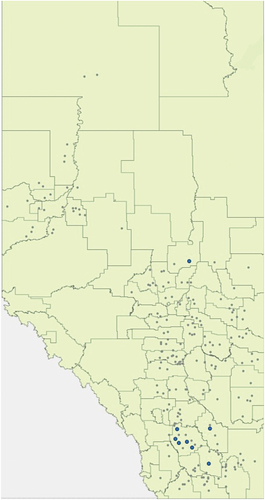
Table 1. Disease symptoms observed in 181 wheat fields in Alberta in 2023.
Table 2. Prevalence of fungi isolated from 28 wheat fields with leaf spot symptoms in Alberta, 2023.
Table 1. Prairie Biovigilance Network (PBN) wheat leaf disease survey results for Alberta, Saskatchewan and Manitoba, 2023.
Table 2. Prairie Biovigilance Network (PBN) 2023 wheat leaf disease survey results based on the number of wheat crops previously grown from 2019-2022.
Table 3. Prairie Biovigilance Network (PBN) 2023 wheat leaf disease survey results based on number of years of non-host crops grown prior to the 2023 wheat crop.
Table 4. Prairie Biovigilance Network (PBN) 2022 wheat leaf disease survey results based on whether samples were collected from fungicide sprayed or unsprayed fields.
Table 5. Prairie Biovigilance Network (PBN) 2023 wheat leaf disease survey results based on overall level of leaf spot resistance.
Table 6. Prairie Biovigilance Network (PBN) 2023 wheat leaf disease survey and varieties grown.
Fig. 1 Soil zone map with common and durum wheat fields surveyed across Saskatchewan in 2023.
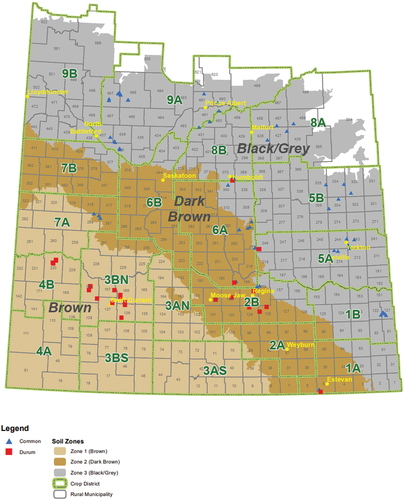
Table 1. Incidence and severity of leaf spotting diseases in common and durum wheat crops surveyed in Saskatchewan in 2023.
Fig. 2 Percentage of average precipitation in the Canadian Prairies from early May to late July of 2023. Normal precipitation based on 1981-2010 (Agriculture and Agri-Food Canada Citation2023).
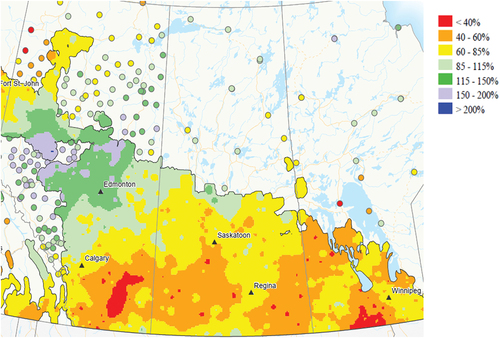
Table 1. Prevalence and severity of fusarium head blight (FHB) in common wheat and durum wheat grouped by soil zone in Saskatchewan in 2023.
Table 2. Prevalence of fields with Fusarium species detected in common and durum wheat crops with FHB symptoms in 2023.
Table 1. Fusarium head blight incidence and severity (FHB index) in spring wheat fields in Manitoba in 2023.
Table 2. Fusarium species isolated from kernels in FHB-affected spring wheat fields in Manitoba in 2023.
Table 1. Leaf spot severity in spring wheat fields in Manitoba in 2023.
Table 2. Bacterial leaf streak (BLS) in spring wheat fields in Manitoba in 2023.
Table 1. Mean leaf disease ratings (0-9 scale), for UGRC breeding lines and check cultivars, in 2023 in Ontario.
Fig. 1 Wheat spike survey sites in Prince Edward Island, 2023. ● = Kings County site, ■ = Queens County sites, ▲ = Prince County sites.
Fig. 2 Field edge sites where airborne inoculum of Fusarium spp. was obtained.
Table 1. Disease incidence and severity of septoria blotch and fusarium head blight and the number of Fusarium spp. isolates collected from wheat spikes in PE spring wheat grower fields in 2023.
Table 2. Fusarium spp. isolates collected from airborne inoculum obtained from air samples at PE field edge sites, 2023.
Table 1. Disease severity rating scales for blossom blight and stem rot of alfalfa.
Fig. 1 Average incidence of alfalfa blossom blight, stem rot and black stem disease symptoms (n=5 fields) at three sampling dates in 2023.
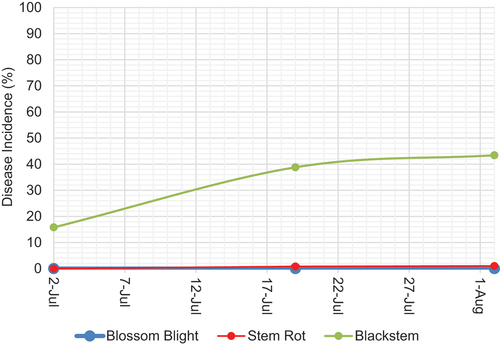
Fig. 2 Average incidence of Botrytis spp. and S. sclerotiorum-infected alfalfa florets (n=5 fields) at three sampling dates in 2023 determined by plating on semi-selective media.
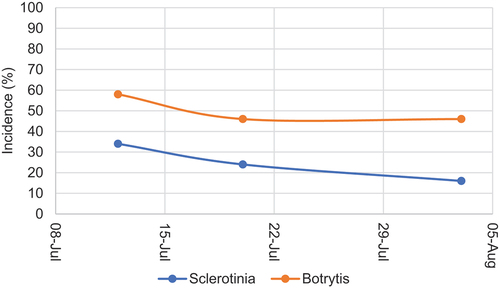
Table 2. Average incidence of three alfalfa diseases in Alberta, 2023.
Table 1. Prevalence and severity of root diseases and halo blight in 41 crops of dry bean in Manitoba in mid- to late July in 2023.
Table 2. Prevalence and severity of foliar diseases in 41 crops of dry bean in Manitoba in August in 2023.
Fig. 1 Blackleg basal stem canker on canola (left) and vascular discolouration in canola stems (right).
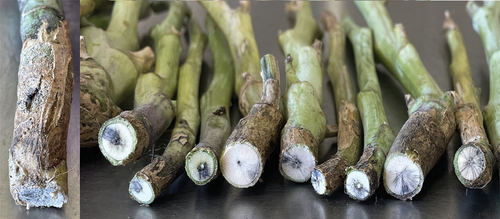
Table 1. Disease prevalence, incidence and severity of three canola diseases in Alberta, 2023.
Fig. 2 Location and severity of blackleg symptoms in 353 canola fields in Alberta, 2023.
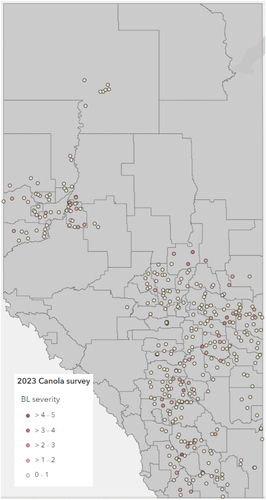
Table 2. Blackleg and stem rot disease occurrence in 61 counties and municipal districts in Alberta, 2023.
Fig. 1 Locations surveyed for canola diseases (red circles) across north-central Alberta in 2023.
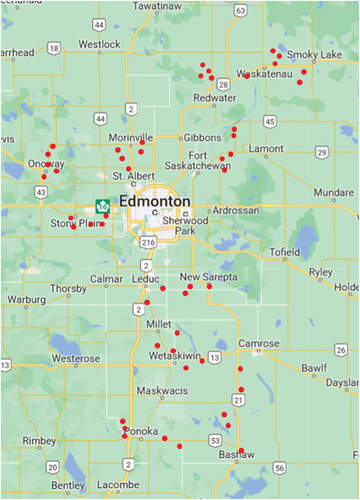
Table 1. Incidence (%) of diseases in canola sampled across north-central Alberta in 2023.
Table 2. Incidence of fungi recovered from diseased canola root samples collected across north-central Alberta in 2023.
Table 1. Cases of clubroot identified on canola crops in Alberta in 2023.
Fig. 1 Distribution of clubroot in Alberta. The disease has been diagnosed in 5,532 canola crops in the province from 2005 to 2023, representing nearly 4,000 individual fields.
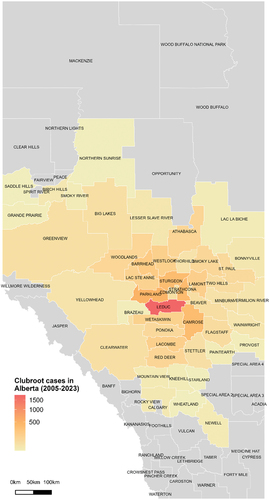
Table 1. Sclerotinia rating scale (Kutcher and Wolf Citation2006).
Table 2. Blackleg rating scale (WCC/RRC 2009).
Table 3. Mean disease incidence and severity of sclerotinia stem rot of canola in Saskatchewan in 2023.
Table 4. Mean disease incidence and severity of blackleg basal cankers in Saskatchewan in 2023.
Table 5. Prevalence of alternaria pod spot, aster yellows, and foot rot of canola fields surveyed in Saskatchewan in 2023.
Table 6. Mean disease incidence and sclerotinia severity reported as both the average severity across infected plants and the average severity across all plants surveyed per field from 2011-2023 (Akhavan et al. Citation2023).
Table 7. Mean blackleg canker severity reported as both the average severity across infected plants and the average severity across all plants surveyed per field from 2011-2023 (Akhavan et al. Citation2023).
Table 1. Mean prevalence, incidence and severity of sclerotinia stem rot and blackleg in Manitoba in 2023.
Table 2. Mean prevalence and incidence or severity of alternaria pod spot, aster yellows, verticillium stripe and foot rot in Manitoba in 2023.
Table 3. Distribution of incidence (sclerotinia, blackleg, aster yellows, verticillium stripe and foot rot) and severity (alternaria pod spot) classes in 129 crops of Brassica napus in Manitoba in 2023.
Table 1. Leaf area affected (% LAA): intensity rating scale for foliar blights of lentil.
Table 2. Canopy area affected (% CAA): rating scale for botrytis grey mould and sclerotinia white mould.
Table 3. Disease prevalence, incidence and severity in 10 lentil fields in Alberta in 2023.
Fig. 1 Locations and root rot severity for 10 lentil fields in southeast Alberta in 2023.
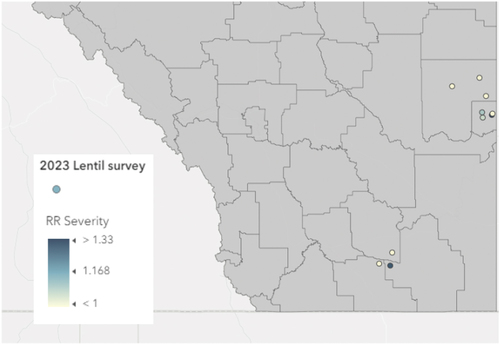
Table 1. Prevalence of plant diseases in lentil crops surveyed in West-central Saskatchewan, 2012-2023.
Table 2. Prevalence of plant diseases in lentil crops surveyed in Southwest Saskatchewan, 2012-2023.
Table 3. Prevalence of plant diseases in lentil crops surveyed in Southeast Saskatchewan, 2012-2023.
Table 4. Prevalence of plant diseases in lentil crops surveyed in East-central Saskatchewan, 2012-2023.
Table 5. Prevalence of plant diseases in lentil crops surveyed in Northeast Saskatchewan, 2012-2023.
Table 6. Prevalence of plant diseases in lentil crops surveyed in Northwest Saskatchewan, 2012-2023.
Table 7. Prevalence of plant diseases in lentil crops surveyed in Saskatchewan, 2012-2023.
Table 8. Average disease incidence in Saskatchewan lentil crops surveyed in 2023.
Table 9. Severity scale for root rot complex of lentil (modified from Chatterton et al. Citation2017).
Table 10. Severity scale for lentil anthracnose (developed by Dr. Michelle Hubbard, Agriculture and Agri-Food Canada).
Table 11. Severity of root rot and anthracnose in Saskatchewan lentil crops in 2023.
Fig. 1 Disease severity at each of the 151 survey locations in Alberta’s 2023 pea disease survey for root rot (RR, left panel) and 150 fields for mycosphaerella blight (Asc, right panel).
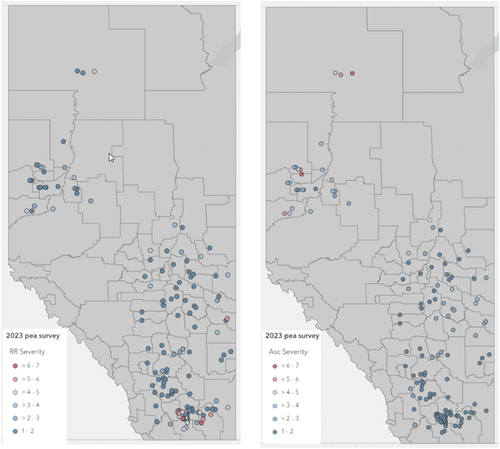
Table 1. Comparison of prevalence, incidence and severity of pea diseases in 2021, 2022 and 2023.
Fig. 2 Prevalence and incidence of five pea diseases in processing and field peas in Alberta in 2023.
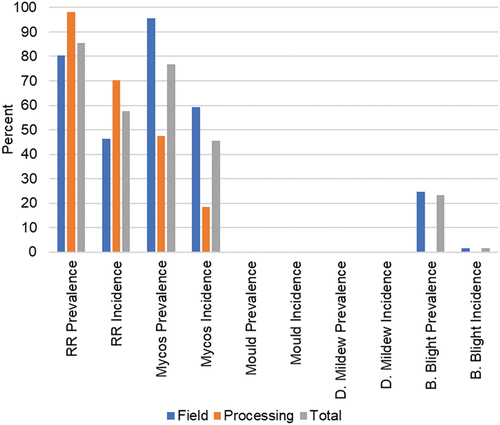
Fig. 3 Severity of root rot and mycosphaerella blight in processing and field peas in Alberta in 2023.
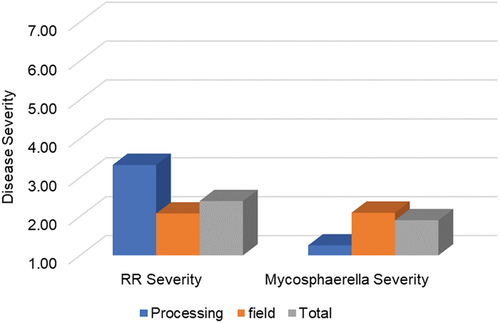
Table 1. Prevalence of root rot complex, mycosphaerella/ascochyta blight complex, white mould, and bacterial blight in Saskatchewan field pea crops in 2023.
Table 2. Incidence and severity of field pea diseases in Saskatchewan in 2023.
Table 3. Severity scale for root rot complex of field pea (modified from Chatterton et al. Citation2017).
Table 4. Severity rating scale for mycosphaerella/ascochyta blight of field pea (modified from Liu et al. Citation2013).
Table 1. Prevalence and severity of root diseases in 47 crops of field pea in Manitoba in 2023.
Table 2. Prevalence and severity of foliar diseases in 47 crops of field pea in Manitoba in 2023.
Table 1. Summary of pulse seed samples tested for pathogens from 2018 to 2022 in Saskatchewan.
Table 2. Number of field pea samples tested from September 2022 to May 2023 and levels of infection with Ascochyta spp., Botrytis spp. and Sclerotinia sclerotiorum for each Saskatchewan crop district.
Table 3. Number of lentil seed samples tested from September 2022 to May 2023 and levels of infection with Ascochyta lentis. Colletotrichum lentis, Botrytis spp., and Sclerotinia sclerotiorum for each Saskatchewan crop district.
Table 4. Number of chickpea seed samples tested from September, 2022 to May 2023 and levels of infection with Ascochyta rabiei, Botrytis spp., and Sclerotinia sclerotiorum for each Saskatchewan crop district.
Table 5. Number of seed samples tested from September 2022 to May 2023 and mean percent germination results (%) for each Saskatchewan crop district.
Table 1. Prevalence, incidence and severity of bacterial blight, brown spot, and downy mildew in Saskatchewan soybean fields in 2023.
Table 1. Prevalence of phytophthora rot and prevalence and severity of root rot in 58 and 20 crops of soybean in Manitoba and Saskatchewan, respectively, in 2023.
Fig. 1 Incidence of garlic pathogen detections on samples collected at five sampling dates between June 8 and July 27, 2023.
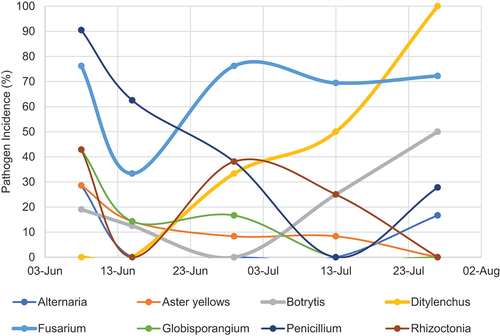
Table 1. Pathogens detected on garlic in Alberta in 2023.