
Figures & data
Table 1. Kaytetye consonantal inventory (Harvey et al., Citation2015, p. 234).
Table 2. Labialized consonant inventory.
Table 3. Kaytetye pre-palatal hypothesis.
Table 4. Proposed vowel inventories for Arandic languages other than Kaytetye.
Table 5. Potential Kaytetye syllable inventories.
Table 6. Verb roots used in the partial reduplication elicitation.
Table 7. Alternative phonological representations of Kaytetye front vowels.
Table 8. Representation of complex rimes in Kaytetye.
Table 9. Hetero-syllabic consonant sequences.
Table 10. Kalkatungu hetero-syllabic consonant sequences.
Table 11. Phonological hypotheses on round vowel realizations.
Table 12. Kaytetye sonority hierarchy.
Table 13. Sonority patterns in [Cwa] sequences.
Figure 1. A partial reduplication construction in Kaytetye, with morpho-syntactic components labelled
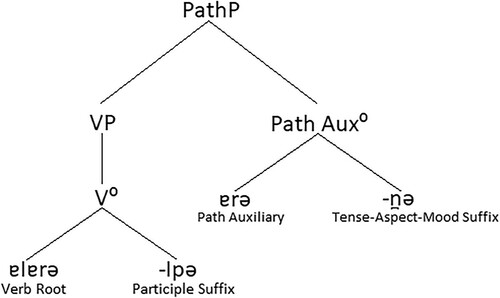
Table 14. Vowel qualities in partial reduplicants, with the ‘base vowel’ and ‘reduplicant vowel’ highlighted.
Figure 2. Mean F1 and F2 values of mid 30% of reduplicative base vowels (dark blue points) and corresponding reduplication vowels (purple points). Ellipses represent mid-point F1 and F2 values based on stipulated vowel phoneme groupings based on transcriptions in kPhon phonetic corpus: /i/ (red), /ə/ (green), /u/ (light blue), /a/ (yellow).
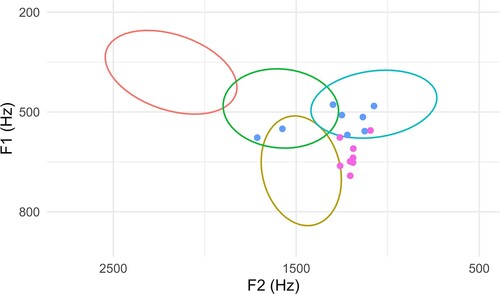
Table 15 Rounding harmony across two syllables.
Figure 3. Scatterplots of first and second formant (F1 and F2) values, with optimal two-cluster (upper panel) and three-cluster (lower panel) fits on z-normalized F1 and F2 vowel midpoint values obtained over 10,000 iterations of unsupervised classification using GMMs. Colour and shape represent classification to a given cluster (e.g. 3G2), and size represents classification uncertainty returned by the GMM. Histograms represent within-cluster proportions of IPA label assignment by human annotators.
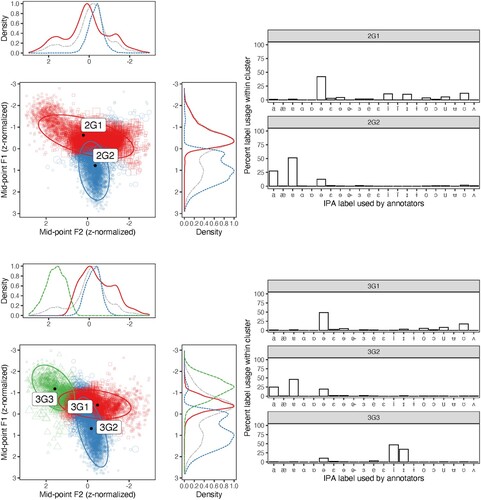
Figure 4. Scatterplots of first and second formant (F1 and F2) values, with optimal four-cluster (upper panel) and five-cluster (lower panel) fits on z-normalized F1 and F2 vowel midpoint values obtained over 10,000 iterations of unsupervised classification using GMMs. Colour and shape represent classification to a given cluster (e.g. 4G1), and size represents classification uncertainty returned by the GMM. Histograms represent within-cluster proportions of IPA label assignment by human annotators.
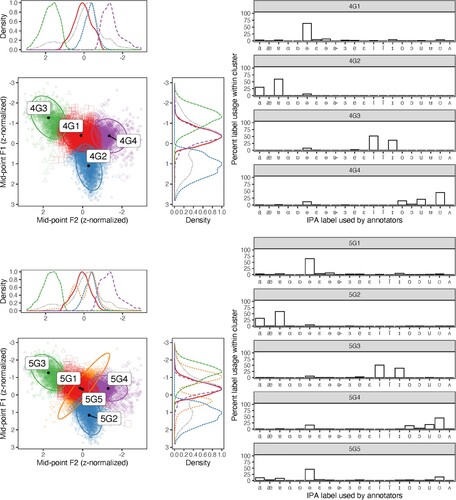
Table 16. Most frequently assigned IPA labels of vowel tokens classified by separate GMMs. Percent usage within cluster in parentheses. Total number of tokens classified remains constant across all models (N = 9,379).
Figure 5. Maximum ICL values from 40,000 iterations of fitting GMMs onto z-normalized mid-point formant (F1, F2) values. Arrowed text labels annotated the maximum ICL value obtained for a given G, the number of clusters fitted by the GMM.
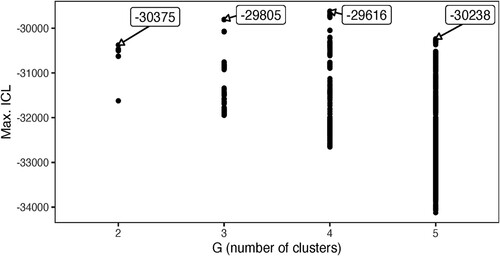
Figure 6. Distribution of 7,496 vowel tokens from four vowel groups (Round, Central, Front, Low) across 36 consonantal contexts, derived as combinations from six places of articulation (Labial, Dental, Alveolar, Retroflex, Palatal, Velar). Percentages reflect proportion of vowel tokens observed for a given context within the vowel group (e.g. 738 of 3,129 central vowel tokens in ALVEOLAR__ALVEOLAR = 23.6%). Parenthesized numbers indicate types (i.e. unique headwords) contributing to token count. Darker cell-shading indicates higher percentages. Dashed lines indicate expected contexts.
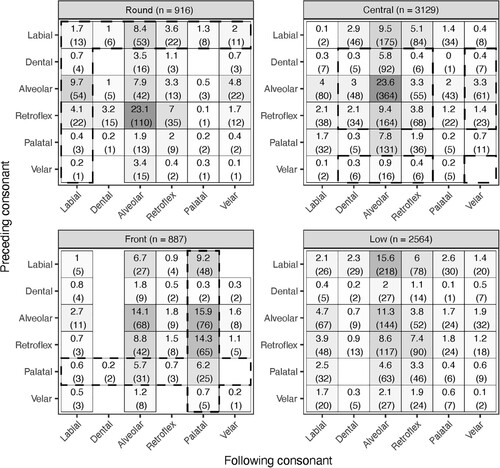
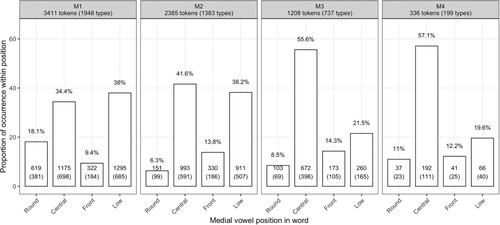
Figure 7. Distribution of four vowel categories (Round, Central, Front, Low) across four medial vowel positions (M1, M2, M3, M4) within Kaytetye words. Bar plots represent proportion of vowel category within a medial position. Figures at top of panels (e.g. M1: 3,411 tokens, 1,948 types) represent total number of types and tokens within position. Figures at the bottom of bars (e.g. M1, Round = 18.1%; 619; 381) represent, respectively, the proportion of vowel category within a medial position and the number of vowel tokens and unique word types.
Data availability statement
The data that support the findings of this study are available on request from the authors. The authors are planning to deposit the data in a public repository.