
Figures & data
Table 1. Participant characteristics in Semester 1 and Semester 2, frequency (percentage).
Table 2. Means, standard deviations, minimum and maximum values of dependent variables.
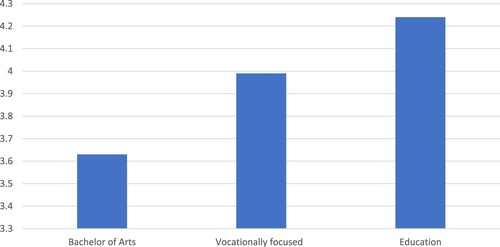
Figure 1. Mean career prospects by degree type (weighted by gender).
Career Prospects Scale.
Belonging Scale.