Figures & data
Figure 1. Weighted line for number of volunteers (n) at each year of age (21–84 years).
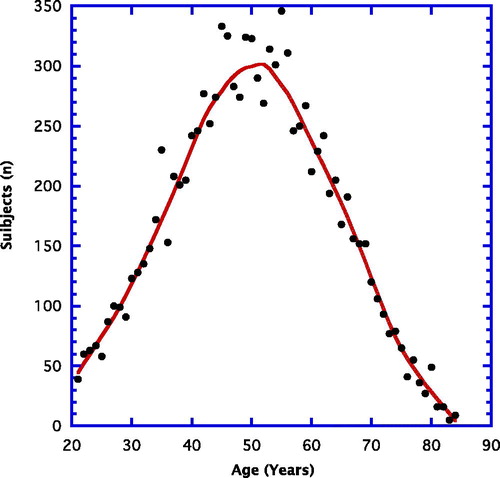
Figure 2. Age vs. average ALT for the given year (21–84 years). A weighted line is shown.
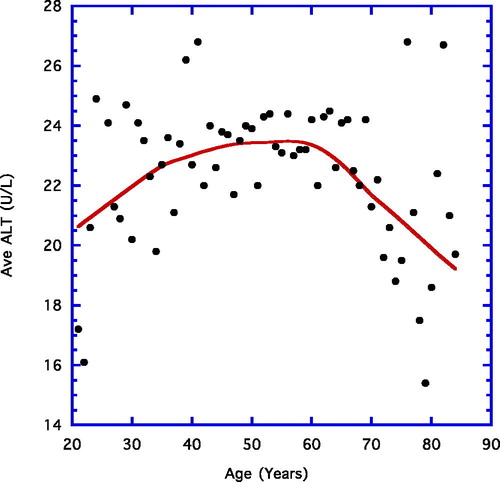
Figure 3. Year of age vs. average group ALT for (21–64 years). Positive correlation is depicted.
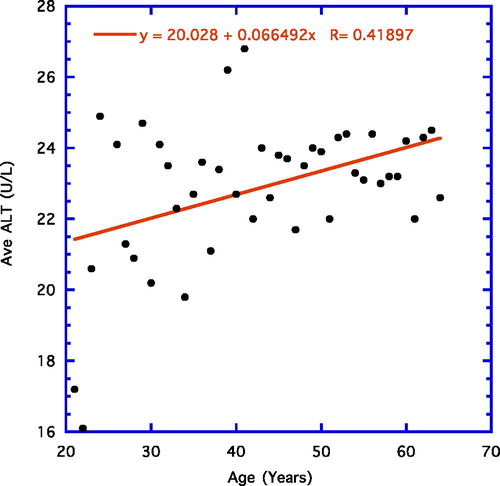
Figure 4. Year of age vs. average ALT (65–84 years). Negative correlation is depicted.
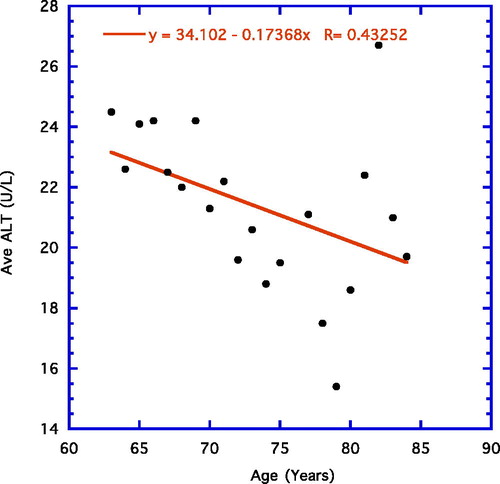
Figure 5. Year of age vs. average AST. Both weighted and linear correlation lines displayed.
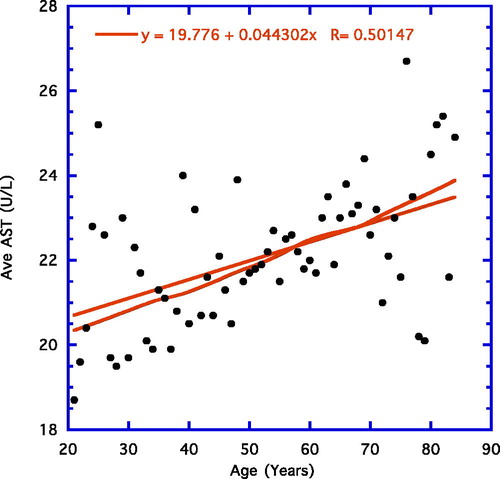
Table 1. Correlation of aminotransferases (ALT, AST) at different ages of individual subjects.
Figure 6. Year of age vs. average FBG. A weighted line is shown.
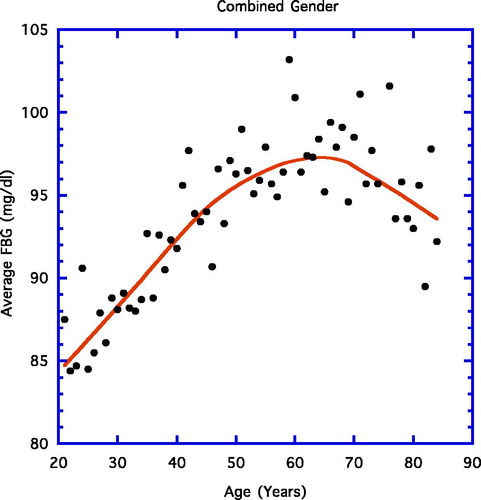
Figure 7. Year of age vs. FBG for older (64–84 years). A negative linear correlation is depicted.
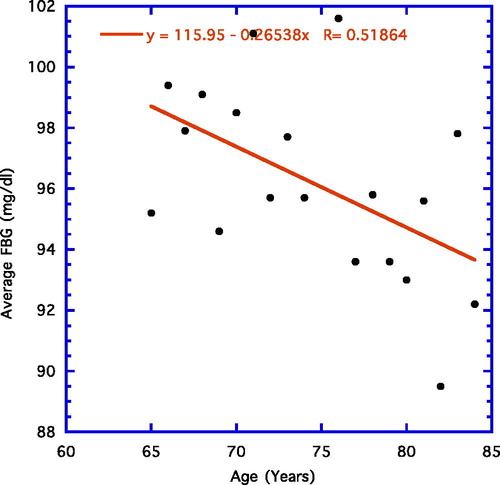
Table 2. Parameters showing aging paradox displayed in grey (age in years vs. dependent variable).
Table 3. Aminotransferases correlations with FBG at different ages of individual subjects.
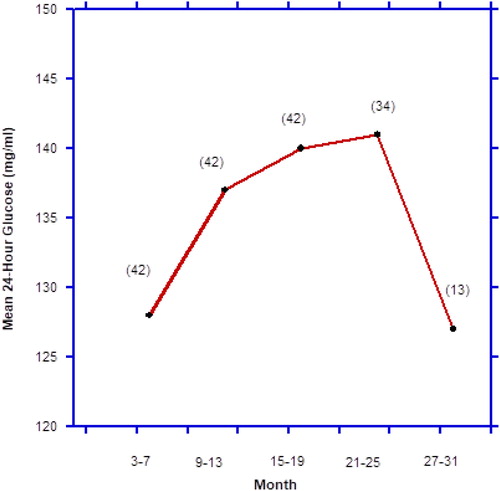
Table 4. Mean 24-hour plasma glucose concentration (mg/dl).
Figure 8. Example of survivor bias. Average mean 24-hour glucose levels over the combined life-span of ad libitum fed and caloric-restricted male F344 rats. Figures in parentheses indicate number of rats surviving at that point. Data derived from Masoro EJ, McCarter RJM, Katz MS, McMahan CA: Dietary restriction alters characteristics of glucose fuel use. J Gerontology. 47:B202–B208, 1992.