Figures & data
Figure 1. Each different shade of blue column illustrates the number of patients (written on the top) in the certain percentile range (n(< 3 pc): 26, n(3–10 pc): 11, n(10–25 pc): 21, n(25–50 pc): 23, n(50–75 pc): 16, n(75–90 pc): 11, n(90–97 pc): 13, n(> 97 pc): 5).
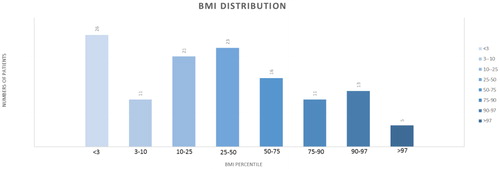
Figure 2. Darker blue: number of patients with serum vitamin D level under the average level; lighter blue: number of patients with serum vitamin D level above the average level; bright point: mean values in each (patient and control) groups.
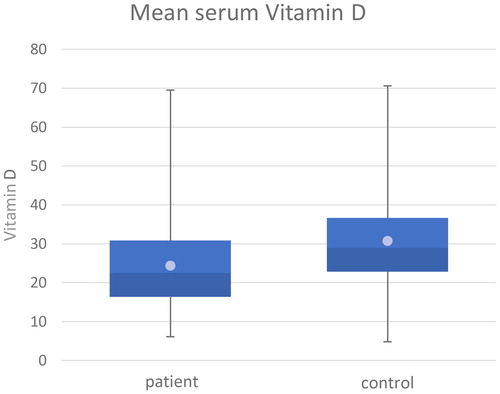
Figure 3. Blue column: number of children in the patient group. Numbers on the blue columns: the percentage of the patients with the certain vitamin D level in patient group (n(< 10 ng/ml): 10, n(< 20 ng/ml): 56, n(< 30 ng/ml): 60, n(> 30 ng/ml): 47). Orange: number of children in the control group. Numbers on the orange columns: the percentage of the children with the certain vitamin D level in control group (n(< 10 ng/ml): 11, n(< 20 ng/ml): 77, n(< 30 ng/ml): 210, n(> 30 ng/ml): 271). Vertical line: vitamin D supplementation reasonable under that (30 ng/ml) serum vitamin D level.
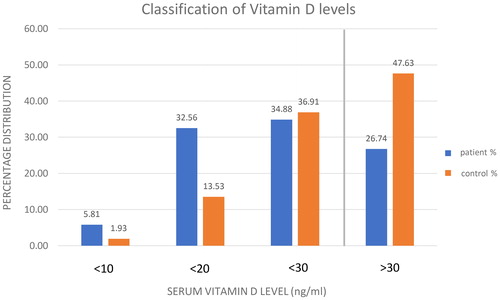
Table 1. Number of patients in different serum vitamin D categories initially.
Table 2. Number of patients in different serum vitamin D categories showing responses to therapy.
Figure 4. The percentage of children with lower than 10 ng/ml serum vitamin D levels before and after vitamin D supplementation. The percentage of children with 10–20 ng/ml serum vitamin D levels before and after vitamin D supplementation. The percentage of children with 20–30 ng/ml serum vitamin D levels before and after vitamin D supplementation. The percentage of children with higher than 30 ng/ml serum vitamin D levels before and after vitamin D supplementation.
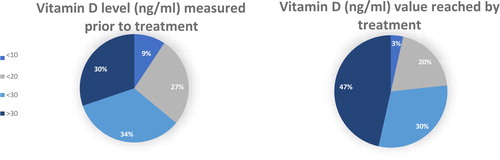
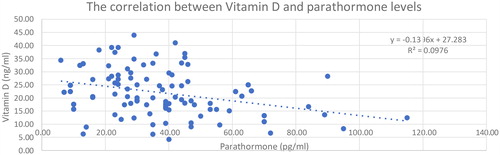
Figure 5. Blue points: the PTH levels measured at the same time as the adherent serum vitamin D level; Blue line: the linear regression; visualise a negative correlation.