
Figures & data
Figure 1. Flow diagram of subjects assessed for eligibility, excluded, randomized, and analyzed for the study. BMI = body mass index; CHO = carbohydrates; HTN = hypertension; PI, principal investigator.
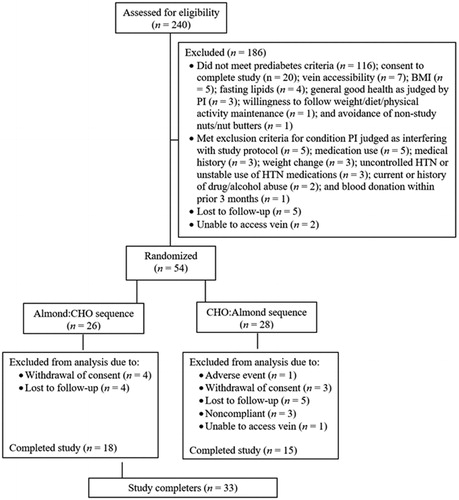
Table 1. Demographic and Anthropometric Baseline Characteristics of Subjects Who Completed the Study.a
Table 2. Energy, Macronutrient, and Select Nutrient Intakes at Baseline and During Almond and Carbohydrate Treatment Periods of Subjects Who Completed the Study (N = 33).Table Footnotea–c
Table 3. Short Intravenous Glucose Tolerance Test and Other Glucose Metabolism Parameters at Baseline and Change or Percentage Change From Baseline Following Almond and Carbohydrate Conditions in Subjects Who Completed the Study (N = 33).Table Footnotea–d
Table 4. Fasting Lipoprotein Lipids and Apolipoproteins at Baseline and Percentage Changes From Baseline Following Almond and Carbohydrate Conditions in Subjects Who Completed the Study (N = 32–33).a–c
Table 5. Fasting Lipoprotein Particle and Subfraction Cholesterol Concentrations Assessed by Density Gradient Ultracentrifugation at Baseline and Changes From Baseline Following Almond and Carbohydrate Conditions in Subjects Who Completed the Study (N = 30–32).a–f
Table 6. Interleukin-6, Adiponectin, High-Sensitivity C-Reactive Protein, Uric Acid, and Blood Pressures at Baseline and Percentage Changes From Baseline Following Almond and Carbohydrate Treatments in Subjects Who Completed the Study (N = 33).a,b