
Figures & data
Figure 1. The cumulative percent of student responses for each of the 6 survey items before and after the nutrition session. Responses were collapsed into 3 ordinal categories: Strongly Disagree/Disagree (red), Neither Agree nor Disagree (yellow), and Strongly Agree/Agree (green). There was a significant improvement in student’s self-perceived knowledge, comfort, and confidence completing a nutritional assessment with a patient (all p-values < 0.001), but no change in student’s beliefs about the importance of nutritional counseling and the role of the physician in the process.
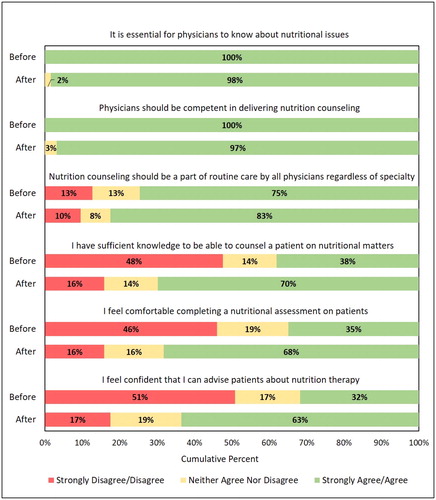
Table 1. Mean (standard deviation) performance scores on the OSCE for the control group and the nutrition workshop group. Nutrition and Communication OSCE scores are depicted as a percentage score, whereas individual nutrition OSCE items are presented as a raw score (based on a scale from 0–2). * indicates p < 0.001.