
Figures & data
Table 2. Nutrient content of the ketone-caffeine-amino acid supplement.
Figure 1. Schematic of the experimental testing session.
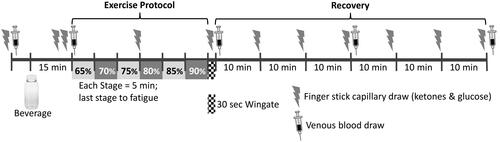
Figure 2. Individual time to exhaustion responses. Bars represent the difference in time to fatigue between the Ketone-Caffeine-Amino Acid (KCA) and Water trials. 10 of 12 Keto-Naïve and 11 of 12 Keto-Adapted participants cycled longer during the KCA trial. Trial (Citation2) x Group (Citation2) ANOVA indicated a significant (P < 0.001) effect of trial.
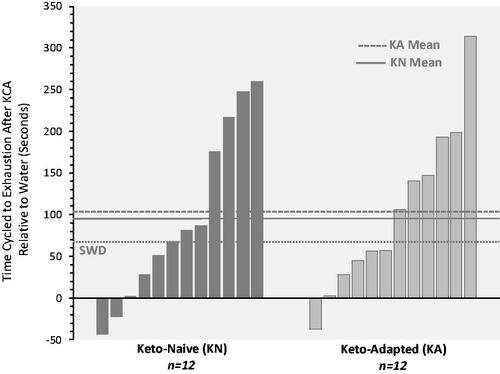
Table 3. Exercise performance responses.
Figure 3. Capillary blood R-beta-hydroxybutyrate (R-BHB) responses to ingestion of a Ketone-Caffeine-Amino Acid (KCA) supplement or Water in 12 Keto-Adapted (A) and 12 Keto-Naïve (B) subjects. Trial (Citation2) x Time (Citation11) ANOVA indicated time and time x trial interaction effects <0.000 for both groups. *P ≤ 0.05 from corresponding baseline value. #P ≤ 0.05 from corresponding Water time point. BL = baseline, MP = Exercise mid-point, IP = immediate post-exercise. Values are mean ± SE.
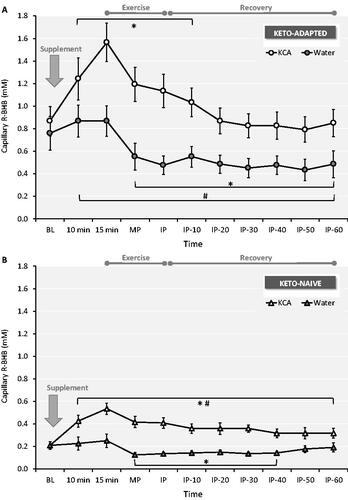
Figure 4. Plasma R-beta-hydroxybutyrate (R-BHB) and S-BHB responses to ingestion of a Ketone-Caffeine-Amino Acid (KCA) supplement or Water in 12 Keto-Adapted (A and C) and 12 Keto-Naïve (B and D) subjects. Trial (Citation2) x Time (Citation5) ANOVA indicated time and time x trial interaction effects <0.001 for all comparisons. *P ≤ 0.05 from corresponding baseline value. #P ≤ 0.05 from corresponding Water time point. BL = baseline, IP = immediate post-exercise. Values are mean ± SE.
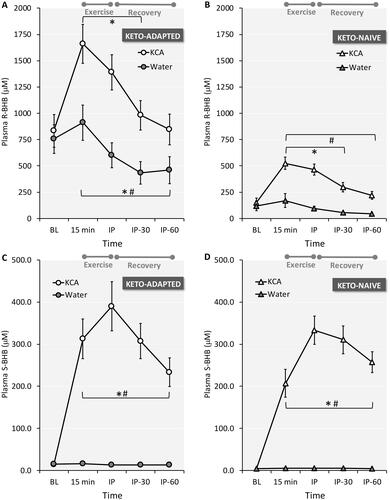
Figure 5. Capillary blood glucose responses to ingestion of a Ketone-Caffeine-Amino Acid (KCA) supplement or Water in 12 Keto-Adapted (A) and 12 Keto-Naïve (B) subjects. Trial (Citation2) x Time (Citation11) ANOVA indicated a main effect of time (<0.001) for both groups. *P ≤ 0.05 from corresponding baseline value. BL = baseline, MP = Exercise mid-point, IP = immediate post-exercise. Values are mean ± SE.
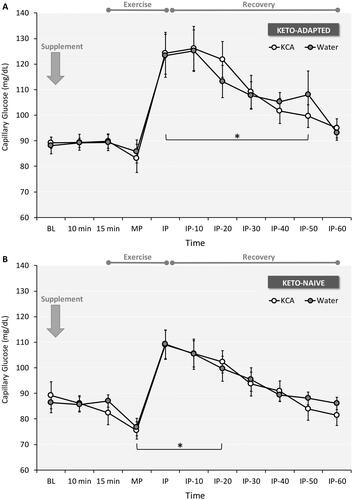
Figure 6. Plasma lactate (A and D), glycerol (B and D), and insulin (C and E) responses to ingestion of a Ketone-Caffeine-Amino Acid (KCA) supplement or Water in 12 Keto-Adapted and 12 Keto-Naïve subjects. Trial (Citation2) x Time (Citation5) ANOVA indicated time effects <0.001 for lactate and glycerol. For lactate, there were significant interaction effects in Keto-Naïve (P = 0.040) and a trend in Keto-Adapted (0.086) subjects. For glycerol, there was a significant interaction effect in Keto-Naïve (P = 0.005) subjects. *P ≤ 0.05 from corresponding baseline value. #P ≤ 0.05 from corresponding Water time point. BL = baseline, IP = immediate post-exercise. Values are mean ± SE.
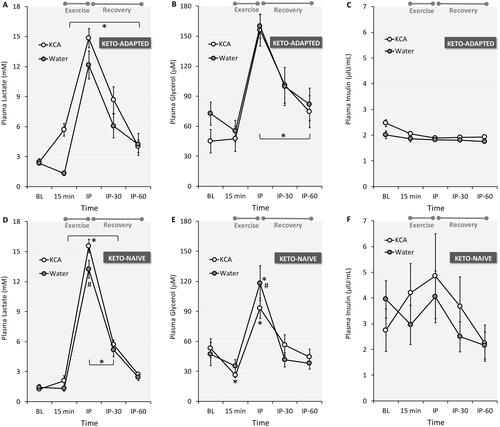
Table 1. Characteristics of groups at baseline.