
Figures & data
Figure 1. Biochemical network displaying differences between almond and cracker groups over 4 and 8 weeks. Metabolites are connected based on biochemical relationships (orange, KEGG RPAIRS), measured structural similarity (blue, Tanimoto coefficient ≥ 0.7), or manually annotated structural similarity (grey). Metabolite size denotes the effect size (Hedge’s g, almond vs cracker group). Metabolite color represents the direction of the effect size i.e. blue, almond > cracker overall (P < 0.05); pink, almond < cracker overall (P < 0.05). Numbers denote the time point at which the larger magnitude of effect size was observed for significant i.e. (P < 0.05) time x snack interactions i.e., 4, week 4; 8, week 8; no number represents significant overall snack effect. P-values are derived from the baseline-adjusted linear mixed model analysis. Shapes display primary metabolic pathways or structural superclass designations obtained via ClassyFire. Metabolites potentially produced by the gut microbiome are highlighted with thick black borders. Clusters of metabolites are circled. Significant metabolites which did not have KEGG identifiers are included as independent nodes with manually annotated edges in their respective pathway clusters. LPC, lysophosphotidylcholine; PC, phosphotidylcholine; SM, sphingomyelins; DG, diglycerides; and TG, triglycerides.
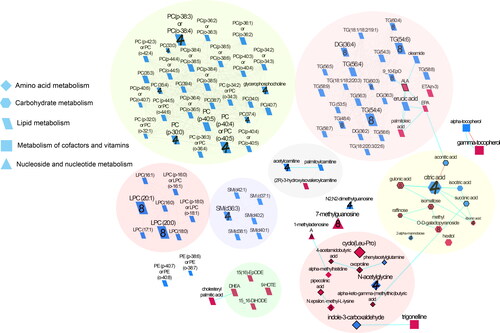
Table 1. Baseline-adjusted least square means of selected metabolites following almond and cracker consumption over 8 weeks.
Table 2. Specific targeted metabolites and their ratios following almond and cracker consumption for 8 weeks.
Table 3. Chemical similarity enrichment analysis results of significant clusters of untargeted serum metabolites measured following almond and cracker consumption over 8 weeks.
Data availability statement
Data is available at https://doi.org/10.6084/m9.figshare.17132201.