
Figures & data
Figure 1. A flow chart showing the study participants.
We randomly allocated participants with sarcopenia to one of the following three groups: completing the exercise intervention alone (RE group), completing the exercise intervention followed by amino acid ingestion (RE + EAA group), and completing the exercise intervention followed by amino acid and tea catechin supplementation (RE + EAA + TCC group)
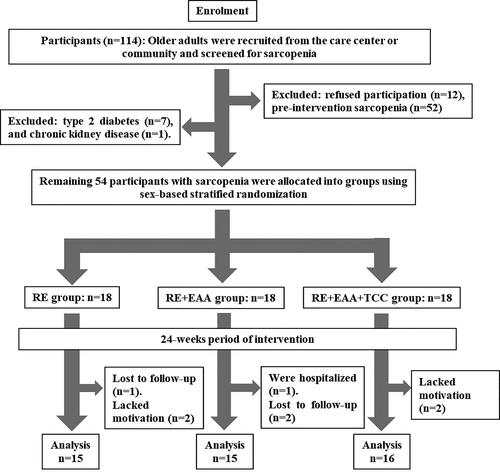
Table 1. Pre-intervention clinical characteristics of participants.
Table 2. Pre- and post-intervention comparison of primary and secondary outcome.
Data availability statement
All data sets generated during and/or analyzed during the current study are not publicly available. However, date sets are available from the corresponding author upon reasonable request.