
Figures & data
Figure 1. Mouth clean (consumption) for Maia across puree, self-feeding, and self-drinking sessions.
Note. Sessions are indicated on each x-axis, with the overall timeline of corresponding days on the bottom panel. For purees, the final three baseline sessions were conducted by the BCBA. During intervention for purees and self-drinking, * indicates that acceptance was scored for empty spoon/cup. In panel 2 (self-feeding), texture/volume advancements are noted as follows (1) 2 × 2 cm, (2) 3 × 3 cm, (3) bite-off soft regular (e.g., cheese stick, cooked carrot stick, sandwich quarters, cooked chicken), and (4) raw regular (e.g., strawberry, pear).
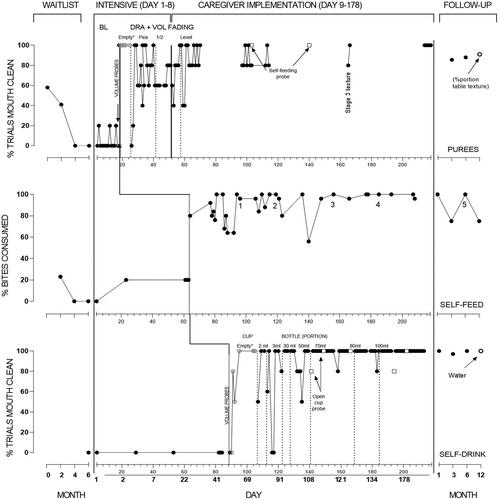
Figure 2. Inappropriate mealtime behaviour (IMB) for Maia across puree, self-feeding, and self-drinking sessions.
Note. Sessions are indicated on each x-axis, with the overall timeline of corresponding days on the bottom panel. For purees, the final three baseline sessions were conducted by the BCBA.
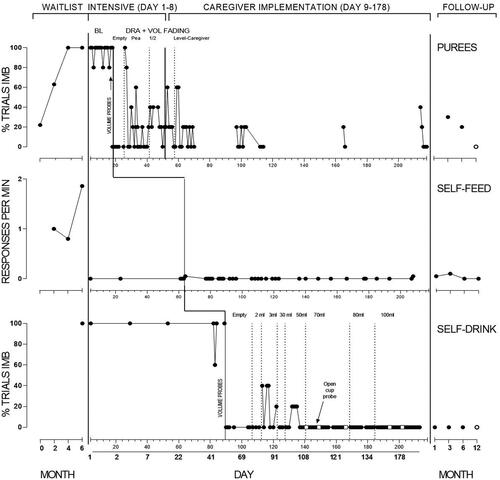
Table 1. Outline of overall timeline of treatment.
Figure 3. Food variety across time points. Number of foods by food group is graphed on left y-axis, with total foods graphed on right y-axis.
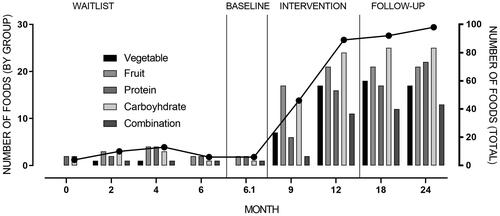
Figure 4. Maia’s daily oral and tube intake.
Note. BL = Baseline. Note that formula was initially provided via spoon by Maia’s caregivers. From Day 79, formula was provided only in a cup or bottle.
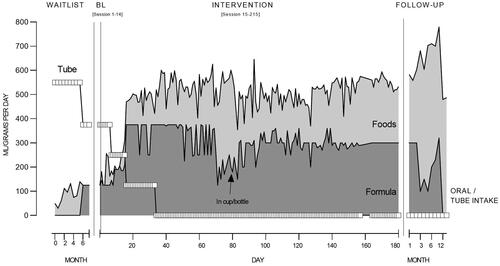
Table 2. Caregiver mean score (range) for each social validity theme.
Table 3. Pediatric Inventory for Parents (PIP) score at pre- and post-intervention.