
Figures & data
Table 1. Week-by-week description of CaregiverTLC.
Figure 1. CONSORT flowchart of participants (Time 1 and Time 2).
Note. Randomization and withdrawal during Time 1 [T1] and Time 2 [T2]
Table 2. Demographic characteristics of caregivers by condition group.
Table 3. Repeated measures time by group for caregivers’ dependent outcomes.
Figure 2. Mean depression scores by group and time.
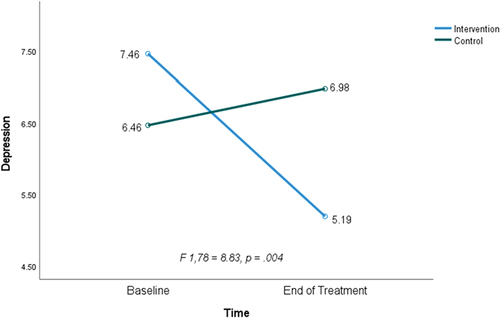
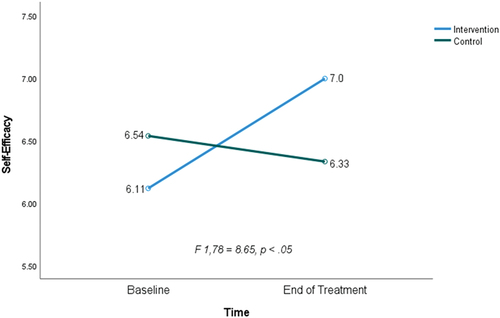
Figure 3. Mean self-efficacy scores by group and time.
Data availability statement
Data are available from the first author upon request.