
Figures & data
Table 1. Detailed inclusion criteria for theoretical replication cohorts.
Table 2. Defined elements for each time series.
Figure 1. Timeline for Bess (P2).
Key: Red- negative medical experience; green: psychosocial support opportunities; pink: neutral days/ events; yellow: positive steps toward discharge Blue: PFI1; Lime Green: PFI2; Purple: PFI3.
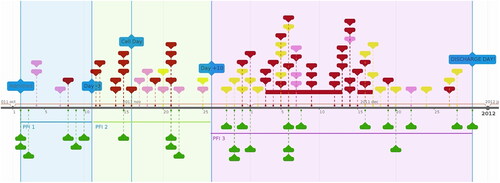
Table 3. Case demographics.
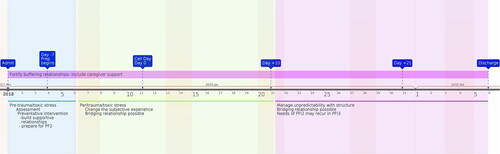
Figure 2. Music therapy for pediatric medical trauma model.
Blue: PFI1; Lime Green: PFI2; Purple: PFI3.
Supplemental material
Supplemental Material
Download MS Word (3.6 MB)Data availability statement
The participants of this study did not give written consent for their data to be shared publicly, so due to the sensitive nature of the research supporting data is not available.